Advertisements
Advertisements
Question
Multiple choice Question. Select the correct option.
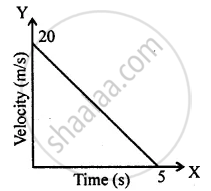
The distance covered in the adjoining velocity-time graph is :
Options
25 m
40 m
50 m
45 m
Solution
50 m
Explanation:
Distance covered = Area under velocity – time graph
=1/2 × base × height
a = 1/2 × 5 × 20 = 50 m
APPEARS IN
RELATED QUESTIONS
What is the quantity which is measured by the area occupied below the velocity-time graph?
A body is moving uniformly in a straight line with a velocity of 5 m/s. Find graphically the distance covered by it in 5 seconds.
Three speed-time graphs are given below :
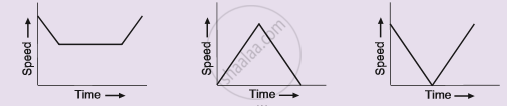
Which graph represents the case of:
(i) a cricket ball thrown vertically upwards and returning to the hands of the thrower ?
(ii) a trolley decelerating to a constant speed and then accelerating uniformly ?
Multiple choice Question. Select the correct option.
The slope of displacement – time graph represents.
Diagram is given below shows velocity – time graph of car P and Q, starting from the same place and in the same direction. Calculate which car is ahead after 10 s and by how much?

Figure shows displacement- time graph of two objects A and B moving in a stra ight line. Which object is moving fa ster?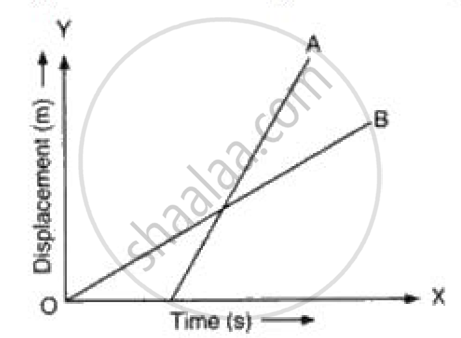
What can you say about the motion of a body if:
Its time-velocity graph is a straight line
What does the slope of velocity-time graph represent?
State whether true or false. If false, correct the statement.
If the velocity – time graph of a particle is a straight line inclined to X-axis then its displacement – time graph will be a straight line.
Mention the uses of the velocity-time graph.
