Advertisements
Advertisements
Question
Draw a graph between volume and temperature, when 5 cm3 of ice at -10°C is heated to form water at +10°C.
Solution
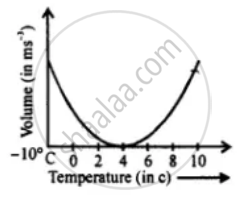
Mass 5 cm3 of water is 5 g
Volume of water in minimum at 4°C.
APPEARS IN
RELATED QUESTIONS
Consider the situation of the previous problem. Assume that the temperature of the water at the bottom of the lake remains constant at 4°C as the ice forms on the surface (the heat required to maintain the temperature of the bottom layer may come from the bed of the lake). The depth of the lake is 1.0 m. Show that the thickness of the ice formed attains a steady state maximum value. Find this value. The thermal conductivity of water = 0.50 W m−1°C−1. Take other relevant data from the previous problem.
A calorimeter contains 50 g of water at 50°C. The temperature falls to 45°C in 10 minutes. When the calorimeter contains 100 g of water at 50°C, it takes 18 minutes for the temperature to become 45°C. Find the water equivalent of the calorimeter.
Describe an experiment to show that water has maximum density at 4°C. What important consequences follow this peculiar property of water? Discuss the importance of this phenomenon in nature.
Explain, why are soft drink bottles not completely filled?
Explain, why are the exposed water pipes lagged with straw during severe winter?
Explain why do vegetables and fruits get damaged during severe frost?
What will be the approximate temperature of water in the lake shown in the following diagram?
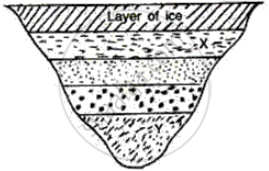
(i) At X, and
(ii) At Y?
Observe the given graph and answer the following questions:
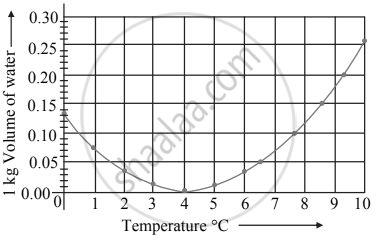
- Name the process represented in the figure.
- At what temperature does this process take place?
