Advertisements
Advertisements
Question
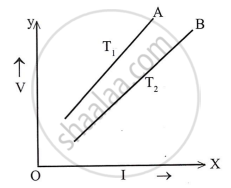
Draw a V-I graph for a conductor at two different temperatures. What conclusion do you draw from your graph for the variation of resistance of conductor with temperature?
Solution

In the above graph, T1 > T2. The straight line A is steeper than line B, which leads us to conclude that the resistance of a the conductor is more at high-temperature T1 than at low-temperature T2. Thus, we can say that the resistance of a conductor increases with an increase in temperature.
APPEARS IN
RELATED QUESTIONS
Two resistors of 4Ω and 6 Ω are connected in parallel to a cell to draw 0.5 A current from the cell.
(i) Draw a labelled circuit diagram showing the above arrangement.
(ii) Calculate the current in each resistor. What is an Ohmic resistor?
When a 4 Ω resistor is connected across the terminals of a 12 V battery, the number of coulombs passing through the resistor per second is:
(a) 0.3
(b) 3
(c) 4
(d) 12
How does the resistance of a pure metal change if its temperature decreases?
To increase the effective resistance in a circuit, the resistors are connected in _______________ .
Bends in a rubber pipe reduce the flow of water through it. How would the bands in a wire affect its electric resistance?
State expression for Resistance connected in parallel.
State expression for Cells connected in parallel.
What is a resistance? Define it with respect to Ohm’s law,
Three resistors of 6Ω, 3Ω and 2Ω are connected together so that their total resistance is greater than 6Ω but less than 8Ω Draw a diagram to show this arrangement and calculate its total resistance.
