Advertisements
Advertisements
Question
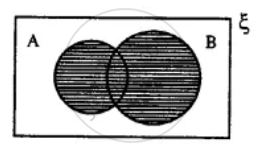
Draw a Venn-diagram to show the relationship between two overlapping sets A and B. Now shade the region representing :
A ∪ B
Solution
A ∪ B =
APPEARS IN
RELATED QUESTIONS
If A = {1, 2, 3, 4, 5}, B = {4, 5, 6, 7, 8}, C = {7, 8, 9, 10, 11} and D = {10, 11, 12, 13, 14}, find:
\[A \cup B \cup D\]
Let \[A = \left\{ x: x \in N \right\}, B = \left\{ x: x - 2n, n \in N \right\}, C = \left\{ x: x = 2n - 1, n \in N \right\}\] and D = {x : x is a prime natural number}. Find: \[A \cap D\]
Let A = {3, 6, 12, 15, 18, 21}, B = {4, 8, 12, 16, 20}, C = {2, 4, 6, 8, 10, 12, 14, 16} and D = {5, 10, 15, 20}. Find: \[A - C\]
Let A = {3, 6, 12, 15, 18, 21}, B = {4, 8, 12, 16, 20}, C = {2, 4, 6, 8, 10, 12, 14, 16} and D = {5, 10, 15, 20}.
Find: \[B - C\]
Let U = {1, 2, 3, 4, 5, 6, 7, 8, 9}, A = {2, 4, 6, 8} and B = {2, 3, 5, 7}. Verify that \[\left( A \cup B \right)' = A' \cap B'\]
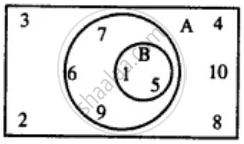
Use the given Venn-diagram to find:
B - A
Two sets A and B are such that A ∩ B = Φ. Draw a venn-diagram to show the relationship between A and B. Shade the region representing :
B - A
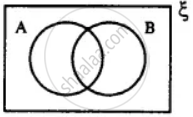
In the given diagram, shade the region which represents the set given underneath the diagrams: (B - A)'

Draw Venn diagram for the following:
No policeman is thief
Take the set of natural numbers from 1 to 20 as universal set and show set X using Venn diagram.
X = {x | x ∈ N, and 7 < x < 15}
