Advertisements
Advertisements
Question
Draw distance-time graph to show:
Increasing velocity
Solution
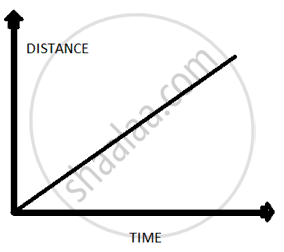
As slope of a distance time graph indicates velocity so a increasing velocity means a straight line having a positive slope with time axis.
APPEARS IN
RELATED QUESTIONS
What is the quantity which is measured by the area occupied below the velocity-time graph?
Show by using the graphical method that: `s=ut+1/2at^2` where the symbols have their usual meanings.
What can you say about the motion of a body if:
its displacement-time graph is a straight line ?
Study the speed-time graph of a car given alongside and answer the following questions:

(i) What type of motion is represented by OA ?
(ii) What type of motion is represented by AB ?
(iii) What type of motion is represented by BC ?
(iv) What is the acceleration of car from O to A ?
(v)What is the acceleration of car from A to B ?
(vi) What is the retardation of car from B to C ?
Given on th e side are a few speed - time graphs for various objects moving along a stra ight line. Refer below figure. (a), (b), (c) and (d).
Which of these graphs represent
(a) Uni form motion
(b) Motion with speed increasing
(c) Motion with speed decreasing and
(d) Motion with speed oscillating.?
What can you conclude if the speed-time graph of a body is a curve moving upwards starting from the origin?
Draw velocity-time graph to show:
Zero acceleration
Write a sentence to explain the shape of graph.
Figure shows the distance-time graph of three students A, B and C. On the basis of the graph, answer the following :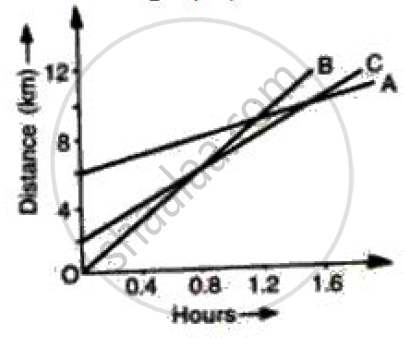
How far did B travel between the time he passed C and A?
The slope of the speed–time graph gives ______.
From the v-t graph, ______ can be calculated.
