Advertisements
Advertisements
Question
Draw distance-time graph to show:
Uniform velocity
Solution
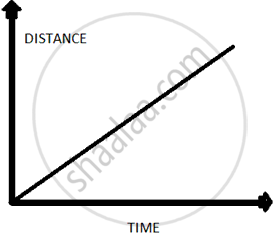
As uniform velocity means slope of line should be constant throughout the motion so this graph also represents uniform velocity
APPEARS IN
RELATED QUESTIONS
Derive the following equation of motion by the graphical method : v2 = u2 + 2as, where the symbols have their usual meanings.
A body is moving uniformly in a straight line with a velocity of 5 m/s. Find graphically the distance covered by it in 5 seconds.
Draw velocity – time graph for the following situation:
When a body is moving with variable velocity, but uniform acceleration.
A train starting from rest picks up a speed of 20 ms−1 in 200 s. It continues to move at the same rate for the next 500 s and is then brought to rest in another 100 s.
- Plot a speed-time graph.
- From graph calculate
(a) uniform rate of acceleration
(b) uniform rate of retardation
(c) total distance covered before stopping
(d) average speed.
Diagram is given below shows velocity – time graph of car P and Q, starting from the same place and in the same direction. Calculate which car is ahead after 10 s and by how much?

How does the slope of a speed-time graph give the acceleration of a body moving along a straight line?
Given below are the speed -time graphs. Match them with their corresponding motions :
 |
(a) Uniformity retared motion |
 |
(b) Non-uniformity acceleration |
 |
(c) Non-uniform motion |
 |
(d) uniform motion |
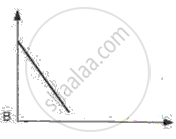
Draw velocity-time graph to show:
Deceleration
Write a sentence to explain the shape of graph.
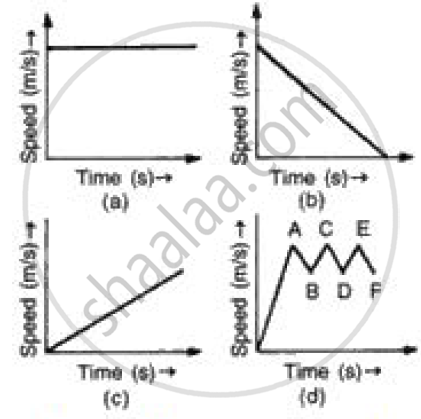
(i) In speed time graph uniform motion is given by a straight line parallel to x axis so figure (a) denotes the uniform motion.
(ii) In speed time graph motion with increasing speed is shown by straight line with positive slope so figure (c) denotes the motion with speed increasing.
(iii) In speed time graph motion with decreasing speed is shown by straight line with negative slope so figure (b) denotes the motion with speed decreasing.
(iv) In speed time graph motion with oscillating speed is shown by zigzag line so figure {d) denotes the motion with speed oscillating.
The area under velocity – time graph represents the ______
