Advertisements
Advertisements
Question
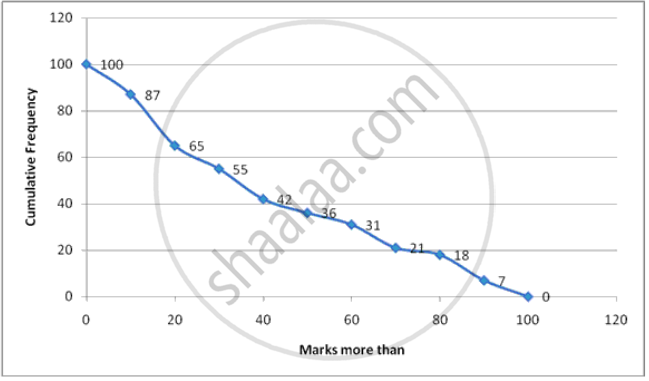
Draw an ogive for the following :
| Marks (More than) | 0 | 10 | 20 | 30 | 40 | 50 | 60 | 70 | 80 | 90 | 100 |
| Cumulative Frequency | 100 | 87 | 65 | 55 | 42 | 36 | 31 | 21 | 18 | 7 | 0 |
Solution
Steps :
1. Start with lower limits of class intervals and from cumulative frequency , subtract the frequency of each class to obtain c.f distribution .
2. Mark lower class limits along x-axis . 1 cm = 5 units
3. Mark cumulative frequencies along y-axis. 1 cm = 5 units
4. Plot points (x,f) where x is the lower limit of one class and f is the corresponding c.f. (0,100),(10,87),(20,65),(30,55),(40,42),(50,36),(60,31),(70,21),(80,18),(90,7),(100,0)
5. Join the points to get the ogive.
| Marks more than | Cumulative Frequency |
| 0 | 100 |
| 10 | 87 |
| 20 | 65 |
| 30 | 55 |
| 40 | 42 |
| 50 | 36 |
| 60 | 31 |
| 70 | 21 |
| 80 | 18 |
| 90 | 7 |
| 100 | 0 |
APPEARS IN
RELATED QUESTIONS
The weight of 50 workers is given below:
| Weight in Kg | 50-60 | 60-70 | 70-80 | 80-90 | 90-100 | 100-110 | 110-120 |
| No. of Workers | 4 | 7 | 11 | 14 | 6 | 5 | 3 |
Draw an ogive of the given distribution using a graph sheet. Take 2 cm = 10 kg on one axis and 2 cm = 5 workers along the other axis. Use a graph to estimate the following:
1) The upper and lower quartiles.
2) If weighing 95 kg and above is considered overweight, find the number of workers who are overweight.
Draw an ogive by less than method for the following data:
| No. of rooms: | 1 | 2 | 3 | 4 | 5 | 6 | 7 | 8 | 9 | 10 |
| No. of houses: | 4 | 9 | 22 | 28 | 24 | 12 | 8 | 6 | 5 | 2 |
The following table gives the height of trees:
| Height | No. of trees |
| Less than 7 Less than 14 Less than 21 Less than 28 Less than 35 Less than 42 Less than 49 Less than 56 |
26 57 92 134 216 287 341 360 |
Draw 'less than' ogive and 'more than' ogive.
The following table gives production yield per hectare of wheat of 100 farms of a village:
| Production yield in kg per hectare: | 50 - 55 | 55 - 60 | 60 - 65 | 65 - 70 | 70 - 75 | 75 - 80 |
| Number of farms: | 2 | 8 | 12 | 24 | 38 | 16 |
Draw ‘less than’ ogive and ‘more than’ ogive.
Draw an ogive for the following :
| Class Interval | 100-150 | 150-200 | 200-250 | 250-300 | 300-350 | 350-400 |
| Frequency | 10 | 13 | 17 | 12 | 10 | 8 |
Draw an ogive for the following :
| Class Interval | 10-19 | 20-29 | 30-39 | 40-49 | 50-59 |
| Frequency | 28 | 23 | 15 | 20 | 14 |
Draw an ogive for the following :
| Marks obtained | Less than 10 | Less than 20 | Less than 30 | Less than 40 | Less than 50 |
| No. of students | 8 | 22 | 48 | 60 | 75 |
Find the width of class 35 - 45.
Using a graph paper, drawn an Ogive for the following distribution which shows a record of the weight in kilograms of 200 students.
| Weight | Frequency |
| 40 - 45 | 5 |
| 45 - 50 | 17 |
| 50 - 55 | 22 |
| 55 - 60 | 45 |
| 60 - 65 | 51 |
| 65 - 70 | 31 |
| 70 - 75 | 20 |
| 75 - 80 | 9 |
Use your ogive to estimate the following:
(i) The percentage of students weighing 55kg or more.
(ii) The weight above which the heaviest 30% of the students fall.
(iii) The number of students who are:
(1) under-weight and
(2) over-weight, if 55·70 kg is considered as standard weight.
The frequency distribution of scores obtained by 230 candidates in a medical entrance test is as ahead:
| Cost of living Index | Number of Months |
| 400 - 450 | 20 |
| 450 - 500 | 35 |
| 500 - 550 | 40 |
| 550 - 600 | 32 |
| 600 - 650 | 24 |
| 650 - 700 | 27 |
| 700 - 750 | 18 |
| 750 - 800 | 34 |
| Total | 230 |
Draw a cummulative polygon (ogive) to represent the above data.
