Advertisements
Advertisements
Question
Histogram shows the number of people owning the different number of books. Answer the question based on it.

The number of people having books more than 20 and less than 40 is ______.
Advertisements
Solution
The number of people having books more than 20 and less than 40 is 14.
Explanation:
Number of people owning books more than 20 but less than 40 = 14
APPEARS IN
RELATED QUESTIONS
Draw histogram for the following frequency distributions:
| Class Interval | 10 – 16 | 16 – 22 | 22 – 28 | 28 – 34 | 34 – 40 |
| Frequency | 15 | 23 | 30 | 20 | 16 |
In the following table, the investment made by 210 families is shown. Present it in the form of a histogram.
|
Investment
(Thousand Rupees) |
10 - 15 | 15 - 20 | 20 - 25 | 25 - 30 | 30 - 35 |
| No. of families | 30 | 50 | 60 | 55 | 15 |
Time alloted for the preparation of an examination by some students is shown in the table. Draw a histogram to show the information.
| Time (minutes) | 60 - 80 | 80 - 100 | 100 - 120 | 120 - 140 | 140 - 160 |
| No. of students | 14 | 20 | 24 | 22 | 16 |
The age groups and the number of persons in the age groups, who donated blood in blood donation camp is given below. Find the measures of central angles to show the information by a pie diagram.
| Age group (Years) | 20-25 | 25-30 | 30-35 | 35-40 |
| No of persons | 80 | 60 | 35 | 25 |
The following table is based on the marks of the first term examination of 10th class students. Show the information by a histogram. Also, draw a frequency polygon with the help of the histogram.
| Class-mark of marks | 325 | 375 | 425 | 475 | 525 | 575 |
| No. of students | 25 | 35 | 45 | 40 | 32 | 20 |
Construct a histogram for the following data:
| Monthly school fee (in Rs): | 30−60 | 60−90 | 90−120 | 120−150 | 150−180 | 180−210 | 210−240 |
| Number of schools: | 5 | 12 | 14 | 18 | 10 | 9 | 4 |
The following histogram shows the number of literate females in the age group of 10 to 40 years in a town: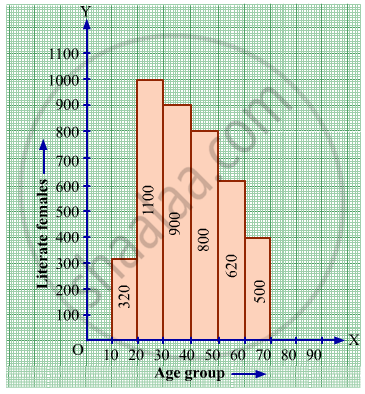
(i) Write the age group in which the number of literate female is the highest.
(ii) What is the class width?
(iii) What is the lowest frequency?
(iv) What are the class marks of the classes?
(v) In which age group literate females are the least?
The following histogram shows the monthly wages (in Rs) of workers in a factory: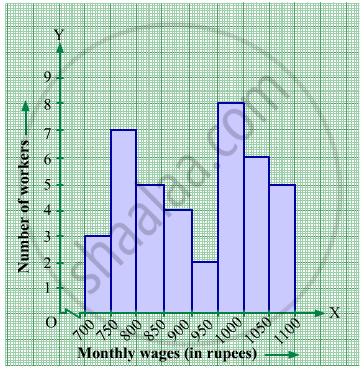
(i) In which wage-group the largest number of workers are being kept? What is their number?
(ii) What wages are the least number of workers getting? What is the number of such workers?
(iii) What is the total number of workers?
(iv) What is the factory size?
Construct histograms for following frequency distribution:
| Class Interval | 130-140 | 140-150 | 150-160 | 160-170 | 170-180 |
| Frequency | 24 | 16 | 29 | 20 | 11 |
Construct a frequency polygon without using a histogram for the following frequency distribution :
| Class Interval | 10-20 | 20-40 | 40-60 | 60-80 | 80-100 |
| Frequency | 9 | 17 | 15 | 20 | 14 |
Draw a histogram for the following frequency distribution.
|
Use of electricity (Unit)
|
50 - 70 | 70 - 90 | 90 - 110 | 110 - 130 | 130 - 150 | 150 - 170 |
| No. of families | 150 | 400 | 460 | 540 | 600 | 350 |
The total area of the histogram is _________ to the total frequency of the given data
In a village, there are 570 people who have cell phones. An NGO survey their cell phone usage. Based on this survey a histogram is drawn
How many of them use the cell phone for more than 5 hours?
Histogram is a graph of a ________ frequency distribution
Draw a histogram for the given frequency distribution
| Age | 41 − 45 | 46 − 50 | 51 − 55 | 56 − 60 | 61 − 65 | 66 − 70 | 71 − 75 |
| Frequency | 4 | 9 | 17 | 25 | 15 | 8 | 2 |
Represent the following data by histogram:
| Price of Sugar (per kg in ₹) | Number of Weeks |
| 18 – 20 | 4 |
| 20 – 22 | 8 |
| 22 – 24 | 22 |
| 24 – 26 | 12 |
| 26 – 28 | 6 |
| 28 – 30 | 8 |
In a histogram ______ are drawn with width equal to a class interval without leaving any gap in between.
Look at the histogram below and answer the questions that follow.
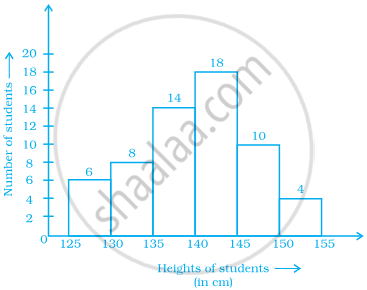
- How many students have height more than or equal to 135 cm but less than 150 cm?
- Which class interval has the least number of students?
- What is the class size?
- How many students have height less than 140 cm?
The below histogram shows the number of literate females in the age group of 10 to 40 years in a town.
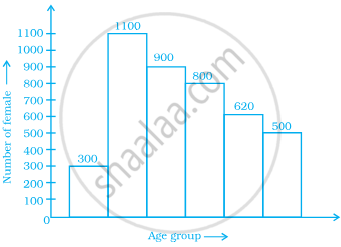
- Write the classes assuming all the classes are of equal width.
- What is the classes width?
- In which age group are literate females the least?
- In which age group is the number of literate females the highest?
