Advertisements
Advertisements
Question
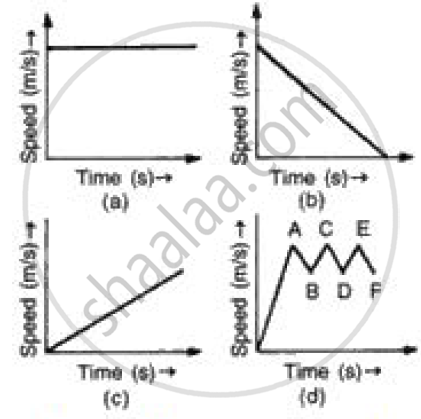
(i) In speed time graph uniform motion is given by a straight line parallel to x axis so figure (a) denotes the uniform motion.
(ii) In speed time graph motion with increasing speed is shown by straight line with positive slope so figure (c) denotes the motion with speed increasing.
(iii) In speed time graph motion with decreasing speed is shown by straight line with negative slope so figure (b) denotes the motion with speed decreasing.
(iv) In speed time graph motion with oscillating speed is shown by zigzag line so figure {d) denotes the motion with speed oscillating.
Solution
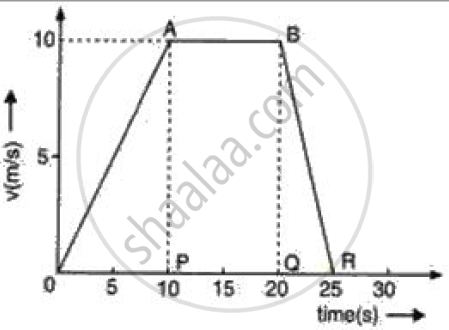
As we know that acceleration is given by the slope of the velocity-time graph so we have to calculate the slope of the graph of each stage of motion,
Acceleration during O to P = (10 - 0)/ (10 - 0) = 1 ms-2
Acceleration during P to Q = (10 - 10)/ (20 - 10) = 0 ms-2
Acceleration during Q to R = (0 - 10) / (25 -20) = - 2 ms-2.
APPEARS IN
RELATED QUESTIONS
Name the two quantities, the slope of whose graph give acceleration.
Draw a velocity-time graph to show the following motion :
A car accelerates uniformly from rest for 5 s ; then it travels at a steady’ velocity for 5 s.
A car of mass 1000 kg is moving with a velocity of 10 m s−1. If the velocity-time graph for this car is a horizontal line parallel to the time axis, then the velocity of car at the end of 25 s will be :
Define speed. What is its S.I. unit?
Draw a displacement-time graph for a boy going to school with uniform velocity.
Multiple choice Question. Select the correct option.
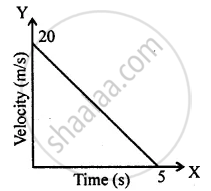
The distance covered in the adjoining velocity-time graph is :
Draw velocity – time graph for the following situation:
When a body, is moving with uniform velocity.
Name the physical quantity which is equal to the area under speed-time graph.
The slope of the speed–time graph gives ______.
Saphira moves at a constant speed in the same direction. Rephrase the same sentence in fewer words using concepts related to motion.
