Advertisements
Advertisements
Question
In a Mathematics test, the following marks were obtained by 40 students. Arrange these marks in a table using tally marks.
| 8 | 1 | 3 | 7 | 6 | 5 | 5 | 4 | 4 | 2 |
| 4 | 9 | 5 | 3 | 7 | 1 | 6 | 5 | 2 | 7 |
| 7 | 3 | 8 | 4 | 2 | 8 | 9 | 5 | 8 | 6 |
| 7 | 4 | 5 | 6 | 9 | 6 | 4 | 4 | 6 | 6 |
Find how many students obtained marks equal to or more than 7.
Solution
| Marks | Tally Marks | Number of Students |
| 1 | || | 2 |
| 2 | ||| | 3 |
| 3 | ||| | 3 |
| 4 | `\cancel(||||)` || | 7 |
| 5 | `\cancel(||||)` | | 6 |
| 6 | `\cancel(||||)`|| | 7 |
| 7 | `\cancel(||||)` | 5 |
| 8 | |||| | 4 |
| 9 | ||| | 3 |
The students who got marks equal to or more than 7 are the students who got either 7, 8 or 9 marks.
Therefore, the number of these students
= 5 + 4 + 3
= 12
APPEARS IN
RELATED QUESTIONS
Define the following term:
Observations
The final mark in mathematic of 30 student are as follow:
| 53, | 61, | 48, | 60, | 78, | 68, | 55, | 100, | 67, | 90, | 75, | 88, | 77, | 37, | 84, |
| 58, | 60, | 48, | 62, | 56, | 44, | 58, | 52, | 64, | 98, | 59, | 70, | 39, | 50, | 60 |
Arrange these marks in the ascending order, 30 to 39 one group, 40 to 49 second group etc.
Now answer the following:
(ii) What is the highest score?
(iii) What is the lowest score?
(iv) What is the range?
(v) If 40 is the pass mark how many have failed?
(vi) How many have scored 75 or more?
(vii) Which observations between 50 and 60 have not actually appeared?
(viii) How many have scored less than 50?
In a study of number of accidents per day, the observations for 30 days were obtained as follows:
| 6, | 3, | 5, | 6, | 4, | 3, | 2, | 5, | 4, | 2, | 4, | 2, | 1, | 2, | 2, |
| 0, | 5, | 4, | 6, | 1, | 6, | 0, | 5, | 3, | 6, | 1, | 5, | 5, | 2, | 6 |
Prepare a frequency distribution table.
Following figures relate to the weekly wages (in Rs) of 15 workers in a factory:
300, 250, 200, 250, 200, 150, 350, 200, 250, 200, 150, 300, 150, 200, 250
Prepare a frequency table.
(i) What is the range in wages (in Rs)?
(ii) How many workers are getting Rs 350?
(iii) How many workers are getting the minimum wages?
The marks scored by 40 students of class VIII in mathematics are given below:
81, 55, 68, 79, 85, 43, 29, 68, 54, 73, 47, 35, 72, 64, 95, 44, 50, 77, 64, 35, 79, 52, 45, 54, 70, 83, 62, 64, 72, 92, 84, 76, 63, 43, 54, 38, 73, 68, 52, 54.
Prepare a frequency distribution with class size of 10 marks.
Construct a frequency table with equal class intervals from the following data on the monthly wages (in rupees) of 28 labourers working in a factory, taking one of the class intervals as 210-230 (230 not included):
220, 268, 258, 242, 210, 268, 272, 242, 311, 290, 300, 320, 319, 304, 302, 318, 306, 292, 254, 278, 210, 240, 280, 316, 306, 215, 256, 236.
The daily minimum temperatures in degrees Celsius recorded in a certain Arctic region are as follows:
−12.5, −10.8, −18.6, −8.4, −10.8, −4.2, −4.8, −6.7, −13.2, −11.8, −2.3, 1.2, 2.6, 0, −2.4, 0, 3.2, 2.7, 3.4, 0, −2.4, −2.4, 0, 3.2, 2.7, 3.4, 0, −2.4, −5.8, −8.9, −14.6, −12.3, −11.5, −7.8, −2.9
Represent them as frequency distribution table taking − 19.9 to − 15 as the first class interval.
The tally marks for number 8 in standard form is ______________
Sumita stood on the road for half an hour and counted the number of vehicles passing by. She made a tally mark for each vehicle. This helped her in counting the total number of vehicles in each group.
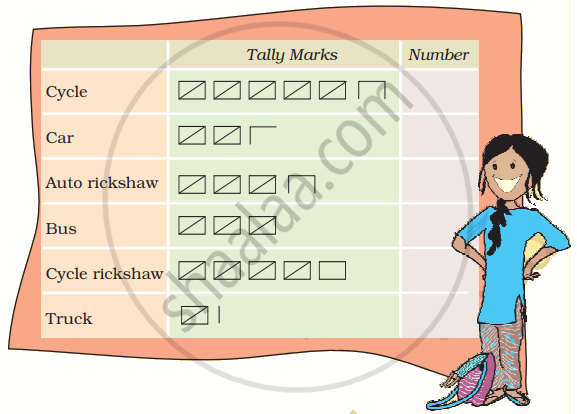
- Write the number of each vehicle in the table.
- How many vehicles in all did Sumita see on the road in half an hour?
- Auto rickshaws are thrice the number of trucks — true/false?
- Make tally marks for 7 more buses and 2 more trucks.
When the number of observations is large, the observations are usually organised in groups of equal width called ______.
