Advertisements
Advertisements
Question
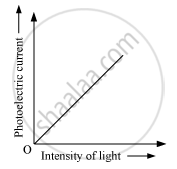
Plot a graph showing the variation of photoelectric current with intensity of light. The work function for the following metals is given:
Na: 2.75 eV and Mo : 4.175 eV.
Which of these will not give photoelectron emission from a radiation of wavelength 3300
\[A^\circ\] from a laser beam? What happens if the source of laser beam is brought closer?
Solution
The plot between photoelectric current and intensity of light varies linearly as shown below:
Given that λ = 3300
\[\times {10}^{- 10}\] m,
\[\phi_{Na} = 2 . 75 eV, \phi_{Mo} = 4 . 175 eV\]
Then energy of the laser beam is
\[E = \frac{hc}{\lambda} = \frac{6 . 6 \times {10}^{- 34} \times 3 \times {10}^8}{3300 \times {10}^{- 10} \times 1 . 6 \times {10}^{- 19}} = 3 . 75 eV\]
Since
\[E < \phi_{Mo}\] therefore there will be no emission of photoelectrons for Molybdenum (Mo).
Bringing the source nearer will bring no change as photoelectric effect is independent of the distance of the source.
APPEARS IN
RELATED QUESTIONS
Write two characteristic features observed is photoelectric effect which supports the photon pictures of electromagnetic radiation ?
Draw a graph between the frequency of incident radiation (υ) and the maximum kinetic energy of the electrons emitted from the surface of a photosensitive material state clearly how this graph can be used to determine (i) Planck’s constant and (ii) work function of the material.
The photocurrent in an experiment on photoelectric effect increases if ______.
Define the following with reference to photoelectric effect :
(a) Threshold frequency (`f_0`)
(b) Stopping potential (`V_s`)
Photoelectric effect is ______.
Lenard observed photoelectric effect using
Which one of the following metals does not exhibit emission of electrons from its surface when irradiated by visible light?
In an experiment on photo electric effect, how does stopping potential change, if at all, when intensity of incident monochromatic UV radiation is increased?
