Advertisements
Advertisements
Question
Plot a graph showing the variation of stopping potential with the frequency of incident radiation for two different photosensitive materials having work functions W1 and W2 (W1 > W2). On what factors does the (i) slope and (ii) intercept of the lines depend?
Solution
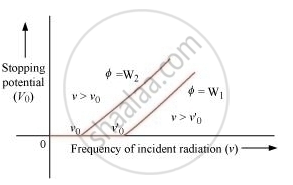
(i) The slope of the graph is content and equals to
(ii) The intercept of the lines depends on the work function ‘’
APPEARS IN
RELATED QUESTIONS
Two wires of equal length, one of aluminium and the other of copper have the same resistance. Which of the two wires is lighter? Hence explain why aluminium wires are preferred for overhead power cables.
(ρAl = 2.63 × 10⁻⁸ Ω m, ρCu = 1.72 × 10⁻⁸ Ω m, Relative density of Al = 2.7, of Cu = 8.9.)
Choose the correct alternative:
Alloys of metals usually have (greater/less) resistivity than that of their constituent metals.
A heating element is marked 210 V, 630 W. What is the value of the current drawn by the element when connected to a 210 V dc source?
Two resistors A and B have resistances RA and RB, respectively, and RA < RB. The resistivities of their materials are ρA and ρB.
A wire of length 1 m and radius 0.1 mm has a resistance of 100 Ω. Find the resistivity of the material.
The electrochemical equivalent of a material depends on _______________ .
Choose the correct alternative:
The resistivity of the alloy manganin is nearly independent of/increases rapidly with increase of temperature.
The resistivity of alloy manganin is ______.
Fuse wire should have
