Advertisements
Advertisements
Question
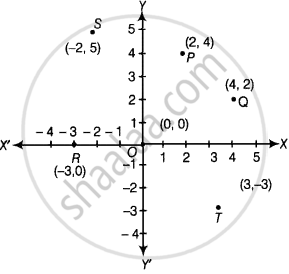
Plot the points (x, y) given by the following table:
| x | 2 | 4 | – 3 | – 2 | 3 | 0 |
| y | 4 | 2 | 0 | 5 | – 3 | 0 |
Solution
On plotting the given points on the graph, we get the points P(2, 4), Q(4, 2), R(–3, 0), S(–2, 5), T(3, – 3) and O(0, 0)
APPEARS IN
RELATED QUESTIONS
Plot the following point on the graph paper:
(0, 7)
Write the equation of the line parallel to the Y-axis at a distance of 7 units from it to its left.
On plotting the points O(0, 0), A(3, 0), B(3, 4), C(0, 4) and joining OA, AB, BC and CO which of the following figure is obtained?
Find the quadrants without plotting the point on a graph sheet.
(5, 7)
Find the quadrants without plotting the point on a graph sheet.
(0, 10)
Plot the following point in a graph sheet.
J(8, −4)
Plot the following point in a graph sheet.
K(0, 7)
If P(–1, 1), Q(3, –4), R(1, –1), S(–2, –3) and T(–4, 4) are plotted on the graph paper, then the point(s) in the fourth quadrant are ______.
If P(5, 1), Q(8, 0), R(0, 4), S(0, 5) and O(0, 0) are plotted on the graph paper, then the point(s) on the x-axis are ______.
In the following figure, coordinates of P are ______.