Advertisements
Advertisements
Question
Study the following figures and answer the following questions.
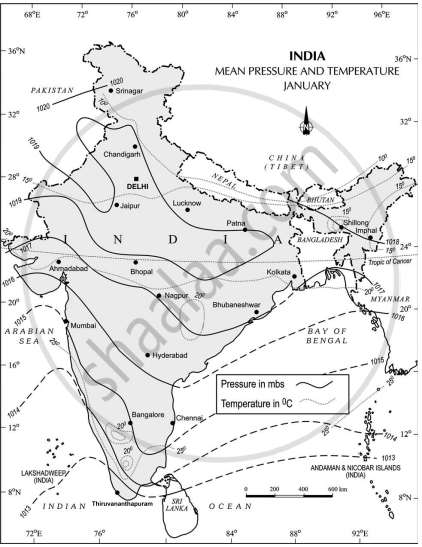
- Which seasons are shown in these maps?
- What is the value of the highest isobar in Figure A and through which part of the country does it pass?
- What are the values of the highest and the lowest isobars in Figure B and where are they located?
- What are the patterns of temperature distribution in both the maps?
- In which parts do you see the highest and the lowest mean temperature in Figure A?
- What relationship do you see between the distribution of temperature and pressure in both the maps?
Figure A
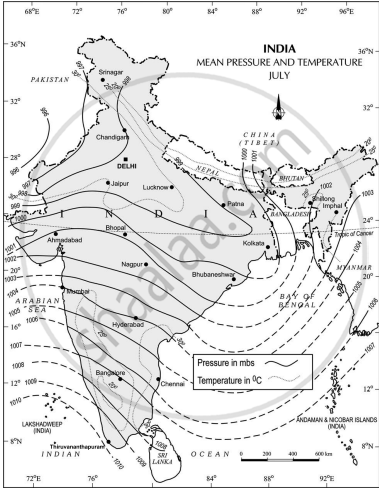
Figure B
Map
Solution
- These maps are showing winter season and monsoon season.
- The value of highest isobar in figure A is 1010 millibar and it is passing through south-west part of the country.
- The value of highest isobar in figure B is 1020 millibar and lowest isobar is 1013 millibar. Highest values are located in Lakshadweep and coastal areas of Kerala and lowest is located in Pakistan.
- In figure A, the temperature of July in South India is 20° and temperature of North India is between 20° to 30°. In figure B the temperature of January in North India is between 10° to 15° and temperature of South India is between 20° to 25°.
- In figure A, we can see highest mean temperature in North India and lowest mean temperature in South India.
shaalaa.com
Weather Maps and Charts
Is there an error in this question or solution?
