Advertisements
Advertisements
Question
The bar graph given below shows the marks of students of a class in a particular subject:

Study the bar graph and answer the following questions:
- If 40 is the pass mark, then how many students have failed?
- How many students got marks from 50 to 69?
- How many students scored 90 marks and above?
- If students who scored marks above 80 are given merits then how many merit holders are there?
- What is the strength of the class?
Solution
a. If 40 is the pass marks, then students who got marks less than 40 will be failed.
∴ Number of students who failed = 4
b. Number of students who got marks from 50 to 69
= Number of students who got marks from 50 to 59 + Number of students who got marks from 60 to 69
= 7 + 11
=18
c. Number of students scored 90 marks and above
= Number of students who scored marks 90 to 92
= 4
d. Number of students who scored marks above 80
= Number of students who score 80 to 89 + Number of students who score 90 to 92
= 6 + 4
= 10
Since. students who scored marks above 80 are given merits.
∴ Number of students who are merit holders = 10
e. Strength of the class = Total number of students who scored different marks
= 4 + 2 + 7 + 11 + 8 + 6 + 4
= 42
APPEARS IN
RELATED QUESTIONS
Read the bar graph (see the given figure) which shows the number of books sold by a bookstore during five consecutive years and answer the questions that follow:
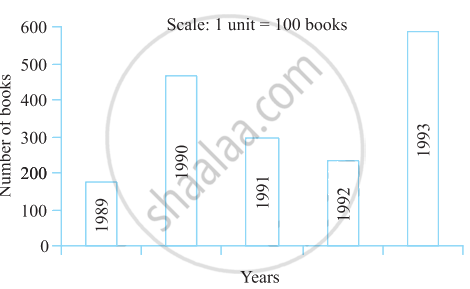
- About how many books were sold in 1989? 1990? 1992?
- In which year were about 475 books sold? About 225 books sold?
- In which years were fewer than 250 books sold?
- Can you explain how you would estimate the number of books sold in 1989?
Plot the points (2, 8), (7, 8) and (12, 8). Join these points in pairs. Do they lie on a line? What do you observe?
Bar diagram of first term scores of a student are given.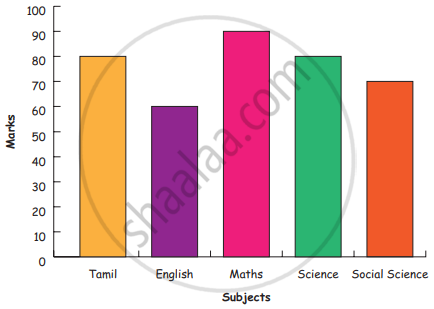
a. The highest score is in _________.
b. The lowest score is in _________.
c. The same scores are in _________ and _________.
Comparison of parts of a whole may be done by a ______.
The graph given below gives the actual and expected sales of cars of a company for 6 months. Study the graph and answer the questions that follow.
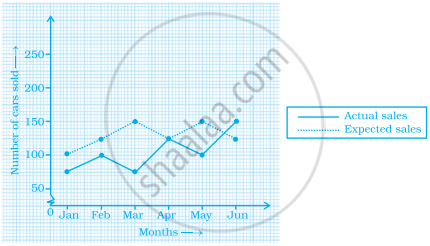
- In which month was the actual sales same as the expected sales?
- For which month(s) was (were) the difference in actual and expected sales the maximum?
- For which month(s) was (were) the difference in actual and expected sales the least?
- What was the total sales of cars in the months–Jan, Feb. and March?
- What is the average sales of cars in the last three months?
- Find the ratio of sales in the first three months to the last three months
To represent the population of different towns using bar graph, it is convenient to take one unit length to represent one person.
The following table gives the number of vehicles passing through a toll gate, every hour from 8.00 am. to 1.00 pm:
| Time Interval |
8.00 to 9.00 |
9.00 to 10.00 |
10.00 to 11.00 |
11.00 to 12.00 |
12.00 to 1.00 |
| Number of vehicles |
250 | 450 | 300 | 250 | 150 |
Draw a bar graph representing the above data.
Study the double bar graph shown below and answer the questions that follow:
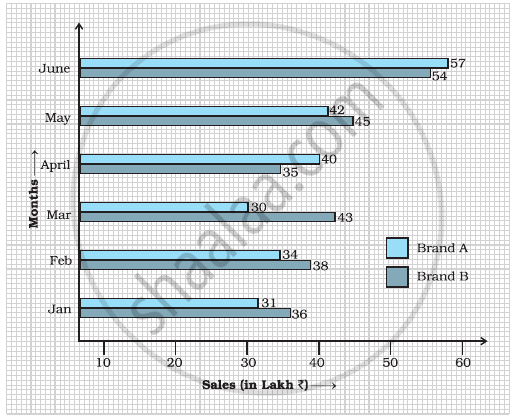
- What information is represented by the above double bar graph?
- In which month sales of Brand A decreased as compared to the previous month?
- What is the difference in sales of both the Brands for the month of June?
- Find the average sales of Brand B for the six months.
- List all months for which the sales of Brand B was less than that of Brand A.
- Find the ratio of sales of Brand A as compared to Brand B for the month of January.
Below is a list of 10 tallest buildings in India.
This list ranks buildings in India that stand at least 150 m (492 ft.) tall, based on standard height measurement. This includes spires and architectural details but does not include antenna marks. Following data is given as per the available information till 2009. Since new buildings are always under construction, go on-line to check new taller buildings.
Use the information given in the table about sky scrapers to answer the following questions:
| Name | City | Height | Floors | Year |
| Planet | Mumbai | 181 m | 51 | 2009 |
| UB Tower | Bengaluru | 184 m | 20 | 2006 |
| Ashok Towers | Mumbai | 193 m | 49 | 2009 |
| The Imperial I | Mumbai | 249 m | 60 | 2009 |
| The Imperial II | Mumbai | 249 m | 60 | 2009 |
| RNA Mirage | Mumbai | 180 m | 40 | 2009 |
| Oberoi Woods Tower I | Mumbai | 170 m | 40 | 2009 |
| Oberoi Woods Tower II | Mumbai | 170 m | 40 | 2009 |
| Oberoi Woods Tower III | Mumbai | 170 m | 40 | 2009 |
| MVRDC | Mumbai | 156 m | 35 | 2002 |
(a) Find the height of each storey of the three tallest buildings and write them in the following table:
| Building | Height | Number of storeys | Height of each storey |
(b) The average height of one storey for the buildings given in (a) is ______.
(c) Which city in this list has the largest percentage of skyscrapers? What is the percentage?
(d) What is the range of data?
(e) Find the median of the data.
(f) Draw a bar graph for given data.
The marks out of 100 obtained by Kunal and Soni in the Half Yearly Examination are given below:
| Subjects | English | Hindi | Maths | Science | S. Science | Sanskirt |
| Kunal | 72 | 81 | 92 | 96 | 64 | 85 |
| Soni | 86 | 89 | 90 | 82 | 75 | 82 |
- Draw a double bar graph by choosing appropriate scale.
- Calculate the total percentage of marks obtained by Soni.
- Calculate the total percentage of marks obtained by Kunal.
- Compare the percentages of marks obtained by Kunal and Soni.
- In how many subjects did Soni get more marks than Kunal? Which are those subjects?
- Who got more marks in S. Science and what was the difference of marks?
- In which subject the difference of marks was maximum and by how much?
