Advertisements
Advertisements
Question
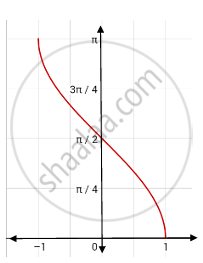
The graph drawn below depicts:

Options
y = sin−1x
y = cos−1x
y = cosec−1x
y = cot−1x
MCQ
Solution
y = cos−1x
Explanation:
The graph represents y = cos−1x, whose domain is [−1, 1] and range is [0, π].
shaalaa.com
Is there an error in this question or solution?
