Advertisements
Advertisements
Question
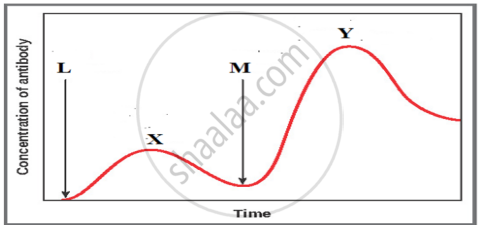
The graph given below indicates the administration of the first (L) and second dose (M) of a vaccine. The corresponding response of the body is indicated by X, and Y. Interpret the graph and explain the reason for such a response shown by the body.
Solution
- On administration of the first dose of the vaccine (L), the body shows a response of low intensity (X) as the immune system comes in contact with the antigenic protein of the weakened/inactivated pathogen for the first time. This is called primary immune response.
- On subsequent encounters with the same antigenic protein in the second dose (M), the body elicits a highly intensified secondary response (Y). Because of the memory of the first contact with the antigen, the secondary immune response is faster and stronger, leading to more effective pathogen elimination in comparison to the primary immune response.
APPEARS IN
RELATED QUESTIONS
Suggest any two possible treatments that can be given to a patient exhibiting adenosine deaminase deficiency.
Compare and contrast the advantages of production of genetically modified crops.
What is gene therapy? Illustrate using the example of adenosine deaminase (ADA) deficiency.
What is gene therapy? Name the first clinical case in which it was used.
Describe the role of bacterium Thermus aquaticus in carrying the process of polymerase chain reaction.
The first clinical gene therapy was done for the treatment of ________.
A probe which is a molecule used to locale-specific sequences in a mixture of DNA or RNA Mole cubs could be ______.
Now a days it is possible to detect the mutated gene causing cancer by allowing a radioactive probe to hybridize its complimentary DNA in a clone of cells, followed by its detection using autoradiography because ______
A host cell must be made competent, before it is able to receive an rDNA. Justify.
Name the technique used to detect the presence of HIV in the body of an individual, Justify the principle associated with this technique.
