Advertisements
Advertisements
प्रश्न
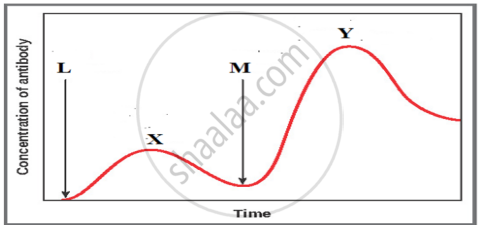
The graph given below indicates the administration of the first (L) and second dose (M) of a vaccine. The corresponding response of the body is indicated by X, and Y. Interpret the graph and explain the reason for such a response shown by the body.
उत्तर
- On administration of the first dose of the vaccine (L), the body shows a response of low intensity (X) as the immune system comes in contact with the antigenic protein of the weakened/inactivated pathogen for the first time. This is called primary immune response.
- On subsequent encounters with the same antigenic protein in the second dose (M), the body elicits a highly intensified secondary response (Y). Because of the memory of the first contact with the antigen, the secondary immune response is faster and stronger, leading to more effective pathogen elimination in comparison to the primary immune response.
APPEARS IN
संबंधित प्रश्न
Answer the following question.
Describe the roles of heat, primers, and the bacterium Thermus aquaticus in the process of PCR.
Which one of the following statements is true regarding DNA polymerase used in PCR?
ELISA technique is based on the principles of antigen-antibody interaction. Can this technique be used in the molecular diagnosis of a genetic disorder, such as phenylketonuria?
If a person thinks he is infected with HIV, due to unprotected sex, and goes for a blood test. Do you think a test such as ELISA will help? If so why? If not, why?
The site of production of ADA the body is ______.
ELISA is based on:
Which of the following is the correct sequence of steps in a PCR (Polymerase Chain Reaction)?
Now a days it is possible to detect the mutated gene causing cancer by allowing a radioactive probe to hybridize its complimentary DNA in a clone of cells, followed by its detection using autoradiography because ______
Can a disease be detected before its symptoms appear? Explain the principle involved.
How is a mature, functional insulin hormone different from its prohormone form?
