Advertisements
Advertisements
Question
The graph given below shows the number of primordial follicles per ovary in women at different ages. Study the graph and answer the questions that follow.
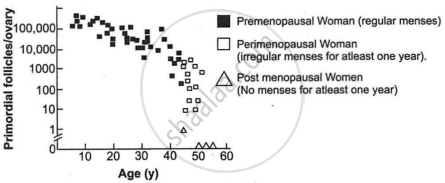
- What is the average age of the women at the onset of menopause?
- At what age are maximum primordial follicles present in the ovary, according to the given graph?
Solution
- 50 years
- 10 years
APPEARS IN
RELATED QUESTIONS
Explain the role of pituitary and the ovarian hormones in menstrual cycle in human females
Why is follicular phase in the menstrual cycle also referred as proliferative phase? Explain.
the biological/technical terms for Fixing of developing zygote on the uterine wall.
Give a significant point of difference between Oestrous and Menstrual cycle.
Briefly describe the secretory phase of the menstrual cycle.
Identify the phase of the menstrual cycle during which there is a peak in the level of progesterone.
All occur during follicular phase of menstrual cycle, EXCEPT
On the fourteenth day of the menstrual cycle the female gamete released is _____.
Exit from the cell cycle and remain dormant for long time by a cell is represented by one of the following phases of the cell cycle:
The onset of menstruation in a human female is called ______.
