Advertisements
Advertisements
Question
The table shows the number of moons that orbit each of the planets in our solar system.
| Planet | Mercury | Venus | Earth | Mars | Jupiter | Saturn | Uranus | Neptune |
| Number of Moons |
0 | 0 | 1 | 2 | 28 | 30 | 21 | 8 |
Make a Bar graph for the above data
Solution
Number of moons that orbit each of the planets in our solar system
Scale: 1 Unit = 2 moons
APPEARS IN
RELATED QUESTIONS
The table below gives the number of children who took part in the various items of the talent show as part of the annual school gathering. Make a bar graph to show this data.
(Scale: on Y-axis, 1cm = 4 children)
| Programme | Theatre | Dance | Vocal music | Instrumental music | One-act plays |
| No. of students | 24 | 40 | 16 | 8 | 4 |
Yashwant gives different amounts of time as shown below, to different exercises he does during the week. Draw a bar graph to show the details of his schedule using an appropriate scale.
| Type of exercise | Running | Yogasanas | Cycling | Mountaineering | Badminton |
| Time | 35 Minutes | 50 minutes | 1 hr 10 min | `1 1/2` hours | 45 minutes |
Write the names of four of your classmates. Beside each name, write his/her weight in kilograms. Enter this data in a table like the above and make a bar graph.
The following data gives total marks (out of 600) obtained by six children of a particular class. Represent the data on a bar graph.
| Students | Ajay | Bali | Dipti | Faiyaz | Geetika | Hari |
| Marks Obtained | 450 | 500 | 300 | 360 | 400 | 540 |
The pictograph below gives the number of absentees on different days of the week in class six. Draw the Bar graph for the same.
| Day | Monday | Tuesday | Wednesday | Thursday | Friday | Saturday |
| Number of Absentees |  |
 |
 |
 |
-- |  |
represents 4 students represents 2 students
The bar graph illustrates the results of a survey conducted on vehicles crossing over a Toll Plaza in one hour.
Observe the bar graph carefully and fill up the following table.
| Vehicles | Buses | _____ | Cars | Vans | _____ | Others | Total vehicles |
| Number of Vehicles |
_____ | 45 | _____ | _____ | 30 | ______ | ______ |
The bar chart represents the number of students using different modes of transport. Observe and answer the following questions.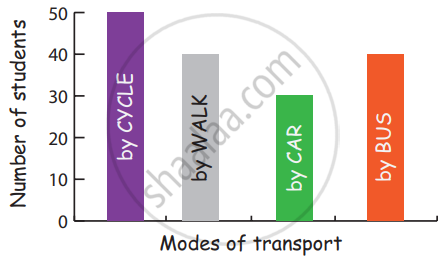
Questions
a. Which mode of transport is mostly used by the students? _____________
b. How many students come to school by walk? ____________
c. Which mode of transport is used the least? ____________
d. How many students come to school by bus? ____________
The cost of a note book is Rs 10. Draw a graph after making a table showing cost of 2, 3, 4, .... note books. Use it to find
- the cost of 7 notebooks.
- the number of note books that can be purchased with Rs 50.
Complete the given table and draw a graph.
| x | 1 | 2 | 4 | 6 |
| y = x – 1 | 0 | - | - | - |
Home appliances sold by a shop in one month are given as below:
| Home appliance | Number of home appliances |
| Refrigerator | 75 |
| Television | 45 |
| Washing Machine | 30 |
| Cooler | 60 |
| DVD Player | 30 |
Draw a bar graph to represent the above information.
