Advertisements
Advertisements
Question
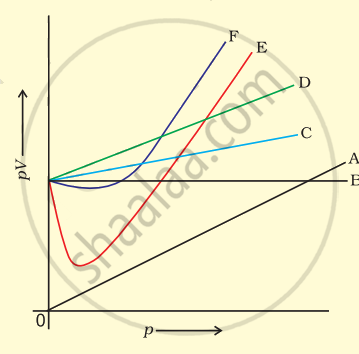
Which curve in figure represents the curve of ideal gas?

Options
B only
C and D only
E and F only
A and B only
Solution
B only
Explanation:
For all ideal gas PV = constant. Only B has no change with the change in PV, so only line B represents the curve of ideal gas.
APPEARS IN
RELATED QUESTIONS
34.05 mL of phosphorus vapour weighs 0.0625 g at 546 °C and 0.1 bar pressure. What is the molar mass of phosphorus?
Calculate the temperature of 4.0 mol of a gas occupying 5 dm3 at 3.32 bar.
(R = 0.083 bar dm3 K–1 mol–1).
The relation between pressure exerted by an ideal gas (Pideal) and observed pressure (Preal) is given by the equation
Pideal = Preal + `(an^2)/V^2`
If pressure is taken in Nm–2, number of moles in mol and volume in m3, Calculate the unit of ‘a’. What will be the unit of ‘a’ when pressure is in atmosphere and volume in dm3?
