Advertisements
Advertisements
Question
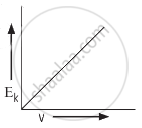
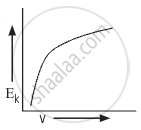
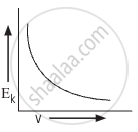
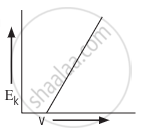
Which of the following graphs correctly represents the variation of maximum kinetic energy (Ek) of photoelectrons with the frequency (𝜈) of the incident radiation?
Options
Solution
APPEARS IN
RELATED QUESTIONS
When radiations of wavelength λ1 and λ2 are incident on certain photosensitive, such that E1 > E2 . Then Planck's constant 'h' is ......................... .
(C = Velocity of light).
State two important properties of photon which are used to write Einstein’s photoelectric equation.
Einstein's photoelectric equation is:
a) `E_"max" = hlambda - varphi_0`
b) `E_"max"= (hc)/lambda varphi_0`
c) `E_"max" = hv + varphi_0`
d) `E_"max" = (hv)/lambda + varphi_0`
Write the basic features of photon picture of electromagnetic radiation on which Einstein’s photoelectric equation is based.
Write Einstein’s photoelectric equation.
According to Einstein’s model minimum energy needed for the electron to escape from a metal surface having work function ϕ0, the electron is emitted with maximum kinetic energy, Kmax = ______.
According to Einstein’s model, the threshold frequency for a metal having work function ϕ0 is given by _________.
The wavelength of matter is independent of
How does stopping potential in photoelectric emission vary if the intensity of the incident radiation increases?
The graphs below show the variation of the stopping potential VS with the frequency (ν) of the incident radiations for two different photosensitive materials M1 and M2.
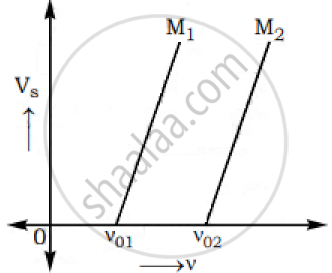
Express work function for M1 and M2 in terms of Planck’s constant(h) and Threshold frequency and charge of the electron (e).
If the values of stopping potential for M1 and M2 are V1 and V2 respectively then show that the slope of the lines equals to `(V_1-V_2)/(V_(01)-V_(02))` for a frequency,
ν > ν02 and also ν > ν01
