Advertisements
Advertisements
Question
With the help of a suitable diagram describe the logistic population growth curve.
Solution 1

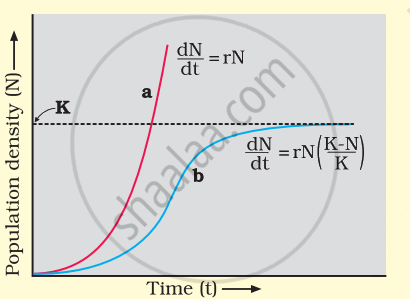
Logistic growth curve of population
- Resources like food and space are not always unlimited. They may be plenty in the beginning; but as the population density increases, competition for those resources starts, resulting in a slowdown in the rate at which the original population was growing. This results in a logistic or sigmoid growth curve.
- Competition between individuals for limited resources will weed out the ‘weaker' ones. Only the ‘fittest’ individuals will survive and reproduce.
- A given habitat has enough resources to support a maximum possible number, beyond which no further growth is possible. This limit can be called nature’s carrying capacity (K) for that species in that habitat.
- A population growing in a habitat with limited resources shows initially a lag phase, followed by phases of acceleration and deceleration, and finally an asymptote when the population density reaches the carrying capacity.
- A plot of population density (N) in relation to time (t) results in a sigmoid curve. This type of population growth is called VerhulstPearl Logistic Growth.
- Since resources for the growth of most animal populations, are finite and become limiting sooner or later, the logistic growth model is considered a more realistic one.
Solution 2
In nature, No population of any species in nature has at its disposal unlimited resources to permit exponential growth. This leads to competition between individuals for limited resources. Eventually, the ‘fittest’ individual will survive and reproduce. In nature, a given habitat has enough resources to support the maximum possible number, beyond which no further growth is possible. Let us call this limit nature’s carrying capacity (K) for that species in that habitat.

A population growing in a habitat with limited resources initially shows a lag phase. This is followed by acceleration and deceleration and finally an asymptote phase. Population density feeding capacity type of population growth is called Verhulst-Pearl Logistic Growth. The following equation represents it –
`(dN)/(dt) = rN ((K - N)/K) = rN (1 - N/K)`
where `(dN)/(dt)` = rate of change in population size
where N = population density at time t,
r = rate of natural increase,
K = feeding capacity
APPEARS IN
RELATED QUESTIONS
Answer the following question.
Mention the term used to describe a population interaction between an orchid growing on a forest tree.
Association between sea anemone and Hermit crab in gastropod shell is that of.
Name the type of association: Hummingbirds and host flowering plants
What is Mortality? What are its two types?
Define population growth. Explain different types of age pyramids.
What is population interaction? Explain the interactions in Mutualism and Competition.
Differentiate between predator and prey.
Identify the interspecific interaction in which species A is harmed and species B is unaffected.
______ is the adaptation of an organism i which it matches its colour with its surroundings to get protected from predators.
Which of the following is TRUE for amensalism?
Which one of the following is an example of predation?
What is brood parasitism? Explain with the help of an example.
Discuss the various types of positive interactions between species.
Name any two categories of organisms that in general are adversely affected by competition.
The value of 'Z' (regression coefficient) lies in the range of ______ regardless of the taxonomic group or the region.
Match the Column I with Column II.
| Column I | Column II |
| A. Lichen | (i) Commensalism |
| B. Shark and Pilot fish | (ii) Mutualism |
| C. Barnacles on the back of a whale | (iii) Symbiotic obligatory relationship |
| D. Sharks and dolphins | (iv) Competition |
Complete the following chart regarding population interaction and re-write:
| Sr. No. | Name of interaction | Interaction between |
| 1. | ? | Plasmodium and Man |
| 2. | ? | Leopard and Lion |
| 3. | ? | Clownfish and Sea-anemone |
"Abingdon tortoise in Galapagos islands became extinct within a decade on introduction of goats in the island." Explain giving reason.
Give one example of Parasitism.
