Advertisements
Chapters
2: Profit , Loss and Discount
3: Compound Interest
4: Expansions
5: Factorisation
6: Changing the subject of a formula
7: Linear Equations
8: Simultaneous Linear Equations
9: Indices
10: Logarithms
11: Triangles and their congruency
12: Isosceles Triangle
13: Inequalities in Triangles
14: Constructions of Triangles
15: Mid-point and Intercept Theorems
16: Similarity
17: Pythagoras Theorem
18: Rectilinear Figures
19: Quadrilaterals
20: Constructions of Quadrilaterals
21: Areas Theorems on Parallelograms
22: Statistics
▶ 23: Graphical Representation of Statistical Data
24: Perimeter and Area
25: Surface Areas and Volume of Solids
26: Trigonometrical Ratios
27: Trigonometrical Ratios of Standard Angles
28: Coordinate Geometry
![Frank solutions for Mathematics [English] Class 9 ICSE chapter 23 - Graphical Representation of Statistical Data - Shaalaa.com](/images/mathematics-english-class-9-icse_6:c41cc344f5174c64a036c55d113af73f.jpg "Frank solutions for Mathematics [English] Class 9 ICSE chapter 23 - Graphical Representation of Statistical Data")
Advertisements
Solutions for Chapter 23: Graphical Representation of Statistical Data
Below listed, you can find solutions for Chapter 23 of CISCE Frank for Mathematics [English] Class 9 ICSE.
Frank solutions for Mathematics [English] Class 9 ICSE 23 Graphical Representation of Statistical Data Exercise 23.1
Harmeet earns Rs.50 000 per month. He a budget for his salary as per the following table:
| Expenses | Accommodation | Food | Clothing | Travel | Miscellaneous | saving |
| Amount (Rs.) | 12000 | 9000 | 2500 | 7500 | 4000 | 15000 |
Draw a bar graph for the above data.
The birth rate thousand of the following states over a certain period is given below:
| States | Punjab | Haryana | U.P. | Gujarat | Rajasthan | Jammu and Kashmir |
| Birth Rate (per thousand ) | 22.9 | 21.8 | 19.5 | 21.1 | 23.9 | 18.3 |
Draw a bar graph for the above data.
Fadil, a class IX student, scored marks in different subjects (each out of total 100) during his annual examination as given below:
| Subject | Maths | English | Science | Social studies | Hindi | Physical education |
| Mark (out of 100) | 75 | 80 | 77 | 78 | 67 | 89 |
Draw horizontal bar graph for the above data.
The number of students in different sections of class IX of a certain school is given in the following table.
| Section | IX-A | IX-B | IX-C | IX-D | IX-E |
| Number of students | 48 | 40 | 50 | 45 | 38 |
Draw horizontal bar graph for the above data.
The number of students (boys and girls) of class IX participating in different activities during their annual day function is given below:
| Activities | Dance | Speech | Singing | Quiz | Drama | Anchoring |
| Boys | 12 | 5 | 4 | 4 | 10 | 2 |
| Girls | 10 | 8 | 6 | 3 | 9 | 1 |
Draw a double bar graph for the above data.
Draw a histogram for the following frequency distribution:
| Train fare | 0 - 50 | 50 - 100 | 100 - 150 | 150 - 200 | 200 - 250 | 250 - 300 |
| No. of travellers | 25 | 40 | 36 | 20 | 17 | 12 |
The following frequency distribution table shows the cost of living in a city in a period of 2years. Draw histogram for this frequency distribution:
| Cost of living | 2000 - 2500 | 2500 - 3000 | 3000 - 3500 | 3500 - 4000 | 4000 - 4500 | 4500 - 5000 | 5000 - 5500 | 5500 - 6000 |
| No. of months | 3 | 4 | 2 | 5 | 3 | 2 | 4 | 1 |
Draw a histogram for the following frequency table:
| Class interval | 5 - 9 | 10 - 14 | 15 - 19 | 20 - 24 | 25 - 29 | 30 - 34 |
| Frequency | 5 | 9 | 12 | 10 | 16 | 12 |
Draw a histogram for the following cumulative frequency table:
| Marks | Less than 10 | Less than 20 | Less than 30 | Less than 40 | Less than 50 | Less than 60 |
| Number of student | 7 | 18 | 30 | 45 | 55 | 60 |
Draw a histogram for the following cumulative frequency table:
| Class interval | 0 - 10 | 10 - 20 | 20 - 30 | 30 - 40 | 40 - 50 |
| Cumulative frequency | 6 | 10 | 18 | 32 | 40 |
Draw a histogram and a frequency polygon for the following data:
| Marks | 0 - 20 | 20 - 40 | 40 - 60 | 60 - 80 | 80 - 100 |
| No. of students | 12 | 18 | 30 | 25 | 15 |
Draw a histogram and a frequency polygon for the following data:
| Wages | 150 - 200 | 200 - 250 | 250 - 300 | 300 - 350 | 350 - 400 | 400 - 450 |
| No. of workers | 25 | 40 | 35 | 28 | 30 | 22 |
Draw a frequency polygon for the following data:
| Expenses | 100 - 150 | 150 - 200 | 200 - 250 | 250 - 300 | 300 - 350 | 350 - 400 |
| No. of families | 22 | 37 | 26 | 18 | 10 | 5 |
Draw a frequency polygon for the following data:
| Class | 15 - 20 | 20 - 25 | 25 - 30 | 30 - 35 | 35 - 40 | 40 - 45 |
| Frequency | 5 | 12 | 15 | 26 | 18 | 7 |
Draw a frequency polygon for the following data:
| Marks | 5 - 9 | 10 - 14 | 15 - 19 | 20 - 24 | 25 - 29 | 30 - 39 |
| No. of students | 7 | 11 | 15 | 22 | 18 | 5 |
Read the following bar graph and answer the following questions: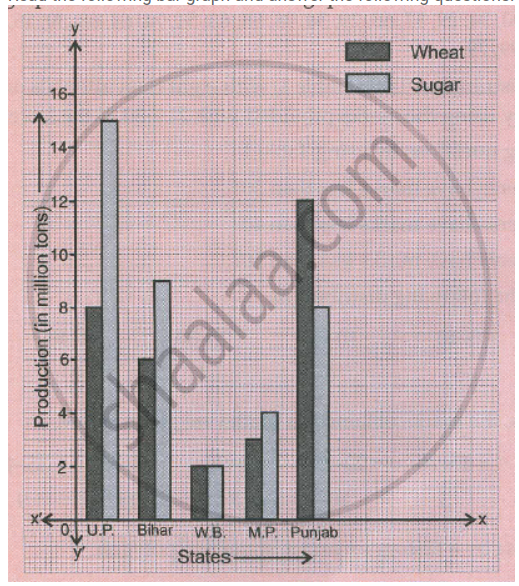
a. What information is given by the graph?
b. Which state is the largest producer of wheat?
c. Which state is the largest producer of sugar?
d. Which state has total production of wheat and sugar as its maximum?
e. Which state has the total production of wheat and sugar minimum?
Solutions for 23: Graphical Representation of Statistical Data
Frank solutions for Mathematics [English] Class 9 ICSE chapter 23 - Graphical Representation of Statistical Data
Shaalaa.com has the CISCE Mathematics Mathematics [English] Class 9 ICSE CISCE solutions in a manner that help students grasp basic concepts better and faster. The detailed, step-by-step solutions will help you understand the concepts better and clarify any confusion. Frank solutions for Mathematics Mathematics [English] Class 9 ICSE CISCE 23 (Graphical Representation of Statistical Data) include all questions with answers and detailed explanations. This will clear students' doubts about questions and improve their application skills while preparing for board exams.
Further, we at Shaalaa.com provide such solutions so students can prepare for written exams. Frank textbook solutions can be a core help for self-study and provide excellent self-help guidance for students.
Concepts covered in Mathematics [English] Class 9 ICSE chapter 23 Graphical Representation of Statistical Data are Variable of Equation, Tabulation of Data, Frequency, Frequency Distribution Table, Class Intervals and Class Limits, Cumulative Frequency Table, Graphical Representation of Data, Concepts of Statistics, Frequency Distribution Table, Graphical Representation of Continuous Frequency Distribution.
Using Frank Mathematics [English] Class 9 ICSE solutions Graphical Representation of Statistical Data exercise by students is an easy way to prepare for the exams, as they involve solutions arranged chapter-wise and also page-wise. The questions involved in Frank Solutions are essential questions that can be asked in the final exam. Maximum CISCE Mathematics [English] Class 9 ICSE students prefer Frank Textbook Solutions to score more in exams.
Get the free view of Chapter 23, Graphical Representation of Statistical Data Mathematics [English] Class 9 ICSE additional questions for Mathematics Mathematics [English] Class 9 ICSE CISCE, and you can use Shaalaa.com to keep it handy for your exam preparation.
