Advertisements
Advertisements
Question
The birth rate thousand of the following states over a certain period is given below:
| States | Punjab | Haryana | U.P. | Gujarat | Rajasthan | Jammu and Kashmir |
| Birth Rate (per thousand ) | 22.9 | 21.8 | 19.5 | 21.1 | 23.9 | 18.3 |
Draw a bar graph for the above data.
Solution
The bar graph is as follows: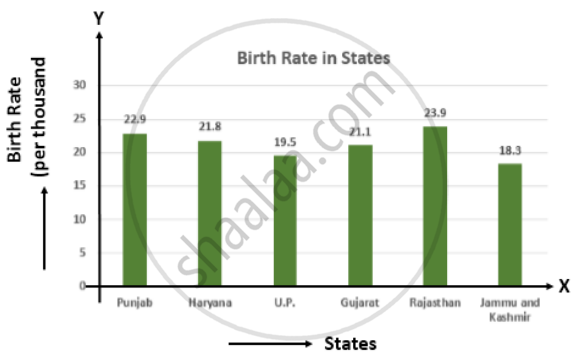
APPEARS IN
RELATED QUESTIONS
100 surnames were randomly picked up from a local telephone directory and a frequency distribution of the number of letters in the English alphabet in the surnames was found as follows:
| Number of letters | Number of surnames |
| 1 - 4 | 6 |
| 4 - 6 | 30 |
| 6 - 8 | 44 |
| 8 - 12 | 16 |
| 12 - 20 | 4 |
- Draw a histogram to depict the given information.
- Write the class interval in which the maximum number of surnames lie.
Given below (Fig. below) is the bar graph indicating the marks obtained out of 50 in mathematics paper by 100 students. Read the bar graph and answer the following questions:

(i) It is decided to distribute work books on mathematics to the students obtaining less than 20 marks, giving one workbook to each of such students. If a work book
costs Rs 5, what sum is required to buy the work books?
(ii) Every student belonging to the highest mark group is entitled to get a prize of Rs. 10. How much amount of money is required for distributing the prize money?
(iii) Every student belonging to the lowest mark—group has to solve 5 problems per day. How many problems, in all, will be solved by the students of this group per day?
(iv) State whether true or false.
a. 17% students have obtained marks ranging from 40 to 49.
b. 59 students have obtained marks ranging from 10 to 29.
(v) What is the number of students getting less than 20 marks?
(vi) What is the number of students getting more than 29 marks?
(vii) What is the number of students getting marks between 9 and 40?
(viii) What is the number of students belonging to the highest mark group?
(ix) What is the number of students obtaining more than 19 marks?
The expenditure (in 10 crores of rupees) on health by the Government of India during the various five year plans is shown below:
| Plans: | I | II | III | IV | V | VI |
| Expenditure on health (in 10 crores of rupees) |
7 | 14 | 23 | 34 | 76 | 182 |
Construct a bar graph to represent the above data.
Which one of the following is not the graphical representation of statistical data:
A frequency polygon is constructed by plotting frequency of the class interval and the
In the 'less than' type of ogive the cumulative frequency is plotted against
The daily wages in a factory are distributed as follows:
|
Daily wages (in Rs.) |
125 - 175 |
175 - 225 |
225 - 275 |
275 - 325 |
325 - 375 |
|
Number of workers |
4 |
20 |
22 |
10 |
6 |
Draw a frequency polygon for this distribution.
The number of students (boys and girls) of class IX participating in different activities during their annual day function is given below:
| Activities | Dance | Speech | Singing | Quiz | Drama | Anchoring |
| Boys | 12 | 5 | 4 | 4 | 10 | 2 |
| Girls | 10 | 8 | 6 | 3 | 9 | 1 |
Draw a double bar graph for the above data.
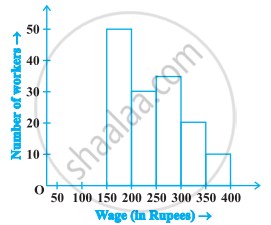
In the following figure, there is a histogram depicting daily wages of workers in a factory. Construct the frequency distribution table.
Following table shows a frequency distribution for the speed of cars passing through at a particular spot on a high way:
| Class interval (km/h) | Frequency |
| 30 – 40 | 3 |
| 40 – 50 | 6 |
| 50 – 60 | 25 |
| 60 – 70 | 65 |
| 70 – 80 | 50 |
| 80 – 90 | 28 |
| 90 – 100 | 14 |
Draw a histogram and frequency polygon representing the data above.
