Advertisements
Advertisements
प्रश्न
Diagram shows a velocity – time graph for a car starting from rest. The graph has three sections AB, BC and CD.

From a study of this graph, state how the distance travelled in any section is determined.
उत्तर
The area under the x-axis gives distance travelled.
APPEARS IN
संबंधित प्रश्न
Given alongside is the velocity-time graph for a moving body :
Find :
(i) Velocity of the body at point C.
(ii) Acceleration acting on the body between A and B.
(iii) Acceleration acting on the body between B and C.

Draw displacement – time graph for the following situation:
When a body is stationary.
A body at rest is thrown downward from the top of the tower. Draw a distance – time graph of its free fall under gravity during the first 3 seconds. Show your table of values starting t = 0 with an interval of 1 second, (g = 10 ms−2).
Diagram is given below shows velocity – time graph of car P and Q, starting from the same place and in the same direction. Calculate which car is ahead after 10 s and by how much?

Draw the speed-time graph of a body when its initial speed is not zero and the speed increases uniformly with time.
Figure shows the velocity-time graphs for two objects A and B moving in same direction . Which object has the greater a cceleration?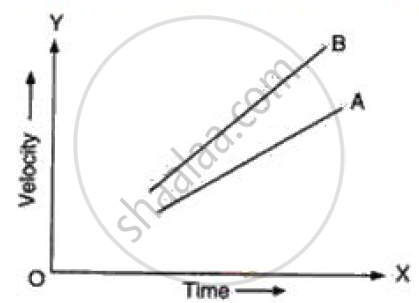
Saphira moves at a constant speed in the same direction. Rephrase the same sentence in fewer words using concepts related to motion.
State whether true or false. If false, correct the statement.
The velocity – time graph of a particle falling freely under gravity would be a straight line parallel to the x axis.
Which of the following can determine the acceleration of a moving object.
From the v-t graph, ______ can be calculated.
