Advertisements
Advertisements
प्रश्न
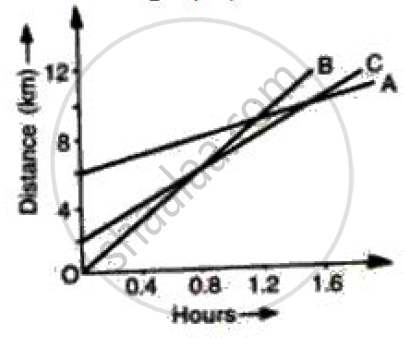
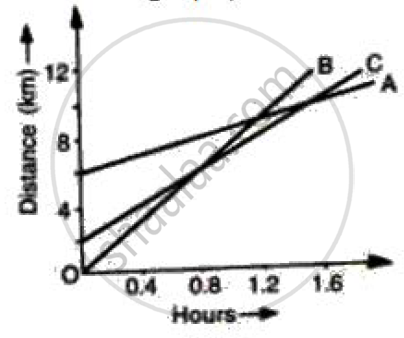
Figure shows the distance-time graph of three students A, B and C. On the basis of the graph, answer the following :
Which of the three is traveling the fastest?
उत्तर

8 is travelling fastest among all the 3 students
APPEARS IN
संबंधित प्रश्न
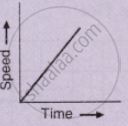
What type of motion is represented by the following graph ?

A car of mass 1000 kg is moving with a velocity of 10 m s−1. If the velocity-time graph for this car is a horizontal line parallel to the time axis, then the velocity of car at the end of 25 s will be :
Draw a velocity-time graph for the free fall of a body under gravity starting from rest. Take g = 10m s-2
Multiple choice Question. Select the correct option.
What does the area of an acceleration – time graph represent?
Diagram shows a velocity – time graph for a car starting from rest. The graph has three sections AB, BC and CD.

From a study of this graph, state how the distance travelled in any section is determined.
Diagram shows a velocity – time graph for a car starting from rest. The graph has three sections AB, BC, and CD.

In which section, car has a zero acceleration?
From the velocity – time graph given below, calculate Distance covered in the region ABCE.

Draw velocity-time graph to show:
Acceleration
Write a sentence to explain the shape of graph.
Draw the distance-time graphs of the bodies P and Q starting from rest, moving with uniform speeds with P moving faster than Q.
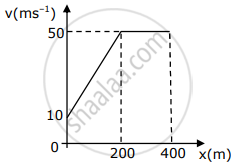
The velocity-displacement graph describing the motion of a bicycle is shown in the figure.

The acceleration-displacement graph of the bicycle's motion is best described by:
