Advertisements
Advertisements
प्रश्न
In a diagnostic test in mathematics given to students, the following marks (out of 100) are recorded:
46, 52, 48, 11, 41, 62, 54, 53, 96, 40, 98, 44
Which ‘average’ will be a good representative of the above data and why?
उत्तर
Consider the data set:
46, 52, 48, 11, 41, 62, 54, 53, 96, 40, 98, 44
Median will be a good representative of the given data. Because:
- Each value occurs once.
- The data is influenced by extreme values.
APPEARS IN
संबंधित प्रश्न
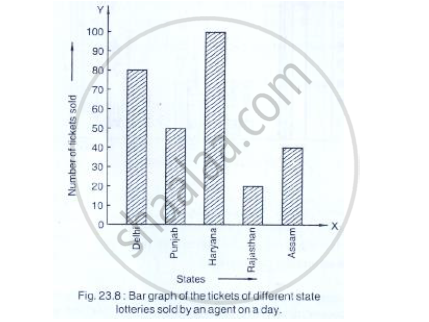
Read the bar graph shown in Fig. 23.8 and answer the following questions:

(i) What is the information given by the bar graph?
(ii) How many tickets of Assam State Lottery were sold by the agent?
(iii) Of which state, were the maximum number of tickets sold?
(iv) State whether true or false.
The maximum number of tickets sold is three times the minimum number of tickets sold.
(v) Of which state were the minimum number of tickets sold?
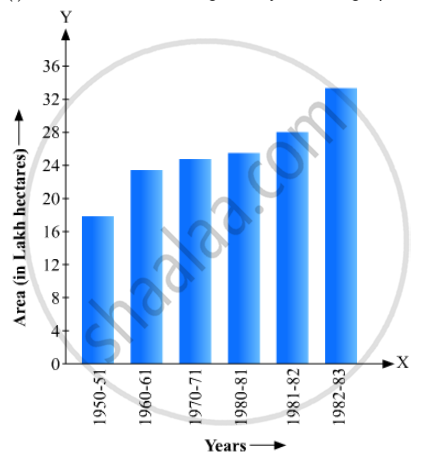
Read the bar graph given in Fig. 23.19 and answer the following questions:
(i) What information is given by the bar graph?

(ii) In which years the areas under the sugarcane crop were the maximum and the minimum?
(iii) State whether true or false:
The area under the sugarcane crop in the year 1982 - 83 is three times that of the year 1950 - 51
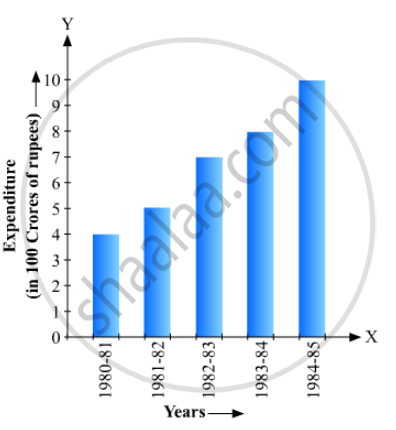
Read the bar graph given in Fig. 23.20 and answer the fol1owing questions:

(i) What information is given by the bar graph?
(ii) What was the expenditure on health and family planning in the year 1982-83?
(iii) In which year is the increase in expenditure maximum over the expenditure in previous year? What is the maximum increase?
The following data shows the average age of men in various countries in a certain year:
| Country | India | Nepal | China | Pakistan | U.K | U.S.A |
| Average age (in years) |
55 | 52 | 60 | 50 | 70 | 75 |
Represent the above information by a bar graph.
The following data gives the demand estimates of the Government of India, Department of Electronics for the personnel in the Computer sector during the Eighth Plan period (1990-95):
| Qualifications: | MCA (Master in Computer applications) |
DCA (Diploma in Computer Applications) |
DCE (Diploma in Computer Engineering) |
CL (Certificate Level Course) |
ST (Short-term Course) |
| Personnel Required | 40600 | 181600 | 18600 | 670600 | 1802900 |
Represent the data with the help of a bar graph. Indicate with the help of the bar graph the course where estimated requirement is least.
Draw frequency polygons for each of the following frequency distribution:
(a) using histogram
(b) without using histogram
|
C.I |
5 -15 | 15 -25 | 25 -35 | 35 - 45 | 45-55 | 55-65 |
| ƒ | 8 | 16 | 18 | 14 | 8 | 2 |
Construct a combined histogram and frequency polygon for the following frequency distribution:
| Class-Intervals | 10 - 20 | 20 - 30 | 30 - 40 | 40 - 50 | 50 - 60 |
| Frequency | 3 | 5 | 6 | 4 | 2 |
The birth rate thousand of the following states over a certain period is given below:
| States | Punjab | Haryana | U.P. | Gujarat | Rajasthan | Jammu and Kashmir |
| Birth Rate (per thousand ) | 22.9 | 21.8 | 19.5 | 21.1 | 23.9 | 18.3 |
Draw a bar graph for the above data.
Is it correct to say that in a histogram, the area of each rectangle is proportional to the class size of the corresponding class interval? If not, correct the statement.
Draw a histogram to represent the following grouped frequency distribution:
| Ages (in years) | Number of teachers |
| 20 – 24 | 10 |
| 25 – 29 | 28 |
| 30 – 34 | 32 |
| 35 – 39 | 48 |
| 40 – 44 | 50 |
| 45 – 49 | 35 |
| 50 – 54 | 12 |
