Advertisements
Advertisements
प्रश्न
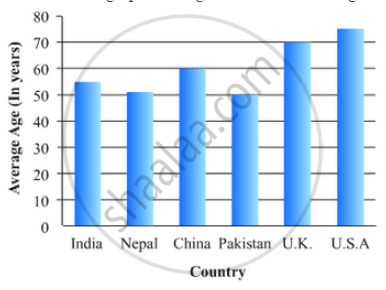
The following data shows the average age of men in various countries in a certain year:
| Country | India | Nepal | China | Pakistan | U.K | U.S.A |
| Average age (in years) |
55 | 52 | 60 | 50 | 70 | 75 |
Represent the above information by a bar graph.
उत्तर
To represent the given data by a vertical bar graph, we first draw horizontal and vertical axes. Let us consider that the horizontal and vertical axes represent the countries and the average age of men’s respectively. We have to draw 6 bars of different lengths given in the table.
At first we mark 6 points in the horizontal axis at equal distances and erect rectangles of the same width at these points. The heights of the rectangles are proportional to the average age of men’s in different countries.
The vertical bar graph of the given data is following:

APPEARS IN
संबंधित प्रश्न
The following table gives the life times of 400 neon lamps:-
| Life time (in hours) | Number of lamps |
| 300 - 400 | 14 |
| 400 - 500 | 56 |
| 500 - 600 | 60 |
| 600 - 700 | 86 |
| 700 - 800 | 74 |
| 800 - 900 | 62 |
| 900 - 1000 | 48 |
- Represent the given information with the help of a histogram.
- How many lamps have a life time of more than 700 hours?
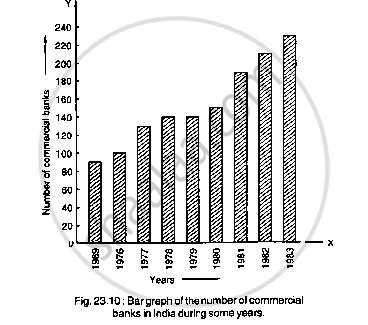
Read the bar graph shown in Fig. 23.10 and answer the following questions
(i) What is the information given by the bar graph?

(ii) What was the number of commercial banks in 1977?
(iii) What is the ratio of the number of commercial banks in 1969 to that in 1980?
(iv) State whether true or false:
The number of commercial banks in 1983 is less than double the number of commercial banks in 1969.
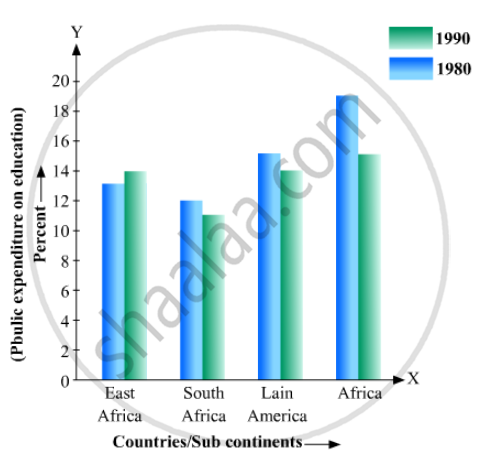
Read the bar graph given in Fig. below and answer the following questions:

(i) What information does it give?
(ii) In which part the expenditure on education is maximum in 1980?
(iii) In which part the expenditure has gone up from 1980 to 1990?
(iv) In which part the gap between 1980 and 1990 is maximum?
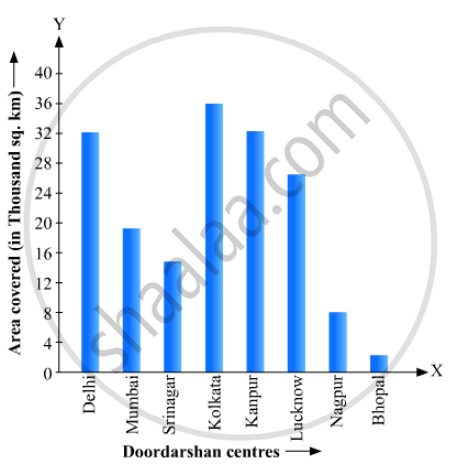
Read the bar graph given in Fig. 23.22 and answer the following questions:

(i) What information is given by the bar graph?
(ii) Which Doordarshan centre covers maximum area? Also tell the covered area.
(iii) What is the difference between the areas covered by the centres at delhi and Bombay?
(iv) Which Doordarshan centres are in U.P State? What are the areas covered by them?
Read the following bar graph and answer the following questions:
(i) What information is given by the bar graph?
(ii) In which year the export is minimum?
(iii)In which year the import is maximum?
(iv)In which year the difference of the values of export and import is maximum?

The production of saleable steel in some of the steel plants our country during 1999 is given below:
| Plant | Bhilai | Durgapur | Rourkela | Bokaro |
| Production (In thousand tonnes) |
160 | 80 | 200 | 150 |
Construct a bar graph to represent the above data on a graph paper by using the scale 1 big divisions = 20 thousand tonnes.
The following is the distribution of total household expenditure (in Rs.) of manual worker in a city:
| Expenditure (in Rs): |
100-150 | 150-200 | 200-250 | 250-300 | 300-350 | 350-400 | 400-450 | 450-500 |
| No. of manual workers: | 25 | 40 | 33 | 28 | 30 | 22 | 16 | 8 |
Draw a histogram and a frequency polygon representing the above data.
In the 'less than' type of ogive the cumulative frequency is plotted against
A hundred students from a certain locality use different modes of travelling to school as given below. Draw a bar graph.
| Bus | Car | Rickshaw | Bicycle | Walk |
| 32 | 16 | 24 | 20 | 8 |
In a diagnostic test in mathematics given to students, the following marks (out of 100) are recorded:
46, 52, 48, 11, 41, 62, 54, 53, 96, 40, 98, 44
Which ‘average’ will be a good representative of the above data and why?
