Advertisements
Advertisements
प्रश्न
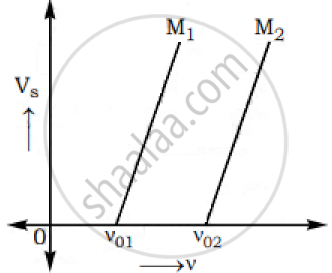
The graphs below show the variation of the stopping potential VS with the frequency (ν) of the incident radiations for two different photosensitive materials M1 and M2.

Express work function for M1 and M2 in terms of Planck’s constant(h) and Threshold frequency and charge of the electron (e).
If the values of stopping potential for M1 and M2 are V1 and V2 respectively then show that the slope of the lines equals to `(V_1-V_2)/(V_(01)-V_(02))` for a frequency,
ν > ν02 and also ν > ν01
उत्तर
`"W"_(01) = ("h"ν_(01))/"e" and "W"_(02) = ("h"ν_(02))/"e"`
`"V"_1 = ["h"/"e"] ν-["h"/"e"]"V"_01`
`"V"_2 = ["h"/"e"]ν-["h"/"e"]"V"_(02)`
∴ `"V"1 - "V"2 = ["h"/"e"]("V"_(01)-"V"_(02))`
`["h"/"e"] = ("V"1-"V"2)/("V"_(01)-"V"_(02))`
APPEARS IN
संबंधित प्रश्न
The energy of photon of wavelength X is_____ .
[h = Planck’s constant, c = speed of light in vacuum]
With reference to the photoelectric effect, define threshold wavelength
Write Einstein’s photoelectric equation.
Calculate the maximum kinetic energy of photoelectrons emitted by a metal (work function = 1.5 eV) when it is illuminated with light of wavelength 198 nm.
Plot a labelled graph of |Vs| where Vs is stopping potential versus frequency f of the incident radiation. State how will you use this graph to determine the value of Planck's constant?
If the frequency of light in a photoelectric experiment is double the stopping potential will
The slope of frequency of incident light and stopping potential for a given surface will be
The moment of a photon is given by
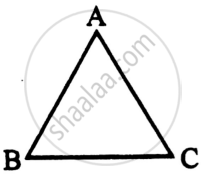
(i) A ray of light incident on face AB of an equilateral glass prism, shows minimum deviation of 30°. Calculate the speed of light through the prism.

(ii) Find the angle of incidence at face AB so that the emergent ray grazes along the face AC.
How does stopping potential in photoelectric emission vary if the frequency of incident radiation decreases?
