Advertisements
Advertisements
प्रश्न
The pocket expenses (per day) of Anuj, during a certain week, from Monday to Saturday were ₹85.40, ₹88.00, ₹86.50, ₹84.75, ₹82.60 and ₹87.25. Find the mean pocket expenses per day.
उत्तर
The pocket expenses (per day) during a certain week are: ₹85.40, ₹88.00, ₹86.50, ₹84.75, ₹82.60 and ₹87.25
∴ Mean of pocket expenses per day =`(85.40+88.00+86.50+84.75+82.60+87.25)/6` ......(Here n = 6)
= `514.5/6`
= ₹85.75
∴ Anuj expenses per day = ₹85.75
APPEARS IN
संबंधित प्रश्न
Calculate the mean of the following distribution using step deviation method.
| Marks | 0-10 | 10-20 | 20-30 | 30-40 | 40-50 | 50-60 |
| Number of students |
10 | 9 | 25 | 0 | 16 | 10 |
The following table gives the heights of plants in centimeter. If the mean height of plants is 60.95 cm; find the value of 'f'.
| Height (cm) | 50 | 55 | 58 | 60 | 65 | 70 | 71 |
| No. of plants | 2 | 4 | 10 | f | 5 | 4 | 3 |
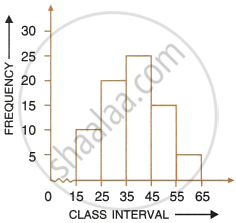
Using the information given in the adjoining histogram, calculate the mean.

The mean of the following distribution is 62.8 and the sum of all the frequencies is 50. Find the missing frequencies f1 and f2.
| Class | 0 – 20 | 20 – 40 | 40 – 60 | 60 – 80 | 80 – 100 | 100 – 120 |
| Frequency | 5 | f1 | 10 | f2 | 7 | 8 |
In a basket there are 10 tomatoes. The weight of each of these tomatoes in grams is as follows:
60, 70, 90, 95, 50, 65, 70, 80, 85, 95.
Find the median of the weights of tomatoes.
Find the mean of the following frequency distribution :
| class | 0-6 | 6-12 | 12-18 | 18-24 | 24-30 |
| Frequency | 7 | 5 | 10 | 12 | 6 |
Find the mean of the following frequency distribution by the step deviation method :
| Class | 0-20 | 20-40 | 40-60 | 60-80 | 80-100 | 100-120 | 120-140 |
| Frequency | 12 | 24 | 52 | 88 | 66 | 42 | 16 |
A researcher studying the behavior of mice has recorded the time (in seconds) taken by each mouse to locate its food by considering 13 different mice as 31, 33, 63, 33, 28, 29, 33, 27, 27, 34, 35, 28, 32. Find the median time that mice spent in searching its food.
Find the median of the 10 observations 36, 33, 45, 28, 39, 45, 54, 23, 56, 25. If another observation 35 is added to the above data, what would be the new median?
In a given data, arranged in ascending or descending order, the middle most observation is called ______.
