Advertisements
Advertisements
प्रश्न
Which of the following diagrams (Figure) depicts ideal gas behaviour?
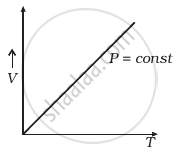 (a) |
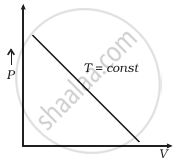 (b) |
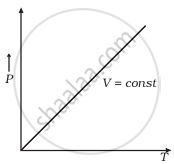 (c) |
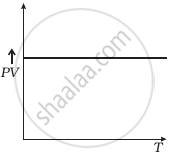 (d) |
उत्तर
a and c
Explanation:
For ideal gas behaviour,
PV = nRT ......(i)
(a) When pressure, P = constant
From (i) Volume V ∝ Temperature T
The graph of V versus T will be a straight line.
(b) When T = constant
From (i) PV = constant
So, the graph of P versus V will be a rectangular hyperbola. Hence this graph is wrong. The correct graph is shown below:
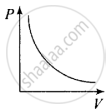
(c) When V = constant
From (i) P ∝ T
So, the graph is a straight line passing through the origin.
(d) From (i) PV ∝ T
⇒ `(PV)/T` = constant
So, the graph of PV versus T will be a straight line parallel to the temperature axis (x-axis).
i.e., the slope of this graph will be zero.
So, (d) is not correct.
APPEARS IN
संबंधित प्रश्न
Molar volume is the volume occupied by 1 mol of any (ideal) gas at standard temperature and pressure (STP: 1 atmospheric pressure, 0 °C). Show that it is 22.4 litres
Estimate the total number of air molecules (inclusive of oxygen, nitrogen, water vapour and other constituents) in a room of capacity 25.0 m3 at a temperature of 27 °C and 1 atm pressure
What do you understand by gas?
During the practical session in the lab when hydrogen sulphide gas having offensive odour is prepared for some test, we can smell the gas even 50 metres away. Explain the phenomenon.
Choose the correct answer:
The graph of PV vs P for gas is
Give reason for the following:
Volumes of gases are converted into s.t.p. conditions and then compared.
The average energy per molecule is proportional to ______
Show that for monoatomic gas the ratio of the two specific heats is 5:3.
Cooking gas containers are kept in a lorry moving with uniform speed. The temperature of the gas molecules inside will ______.
For a wave, y = 0.0002 sin`[2pi(110"t"-x/3)+pi/3]` is travelling in a medium. The energy per unit volume being transferred by wave if density of medium is 1.5 kg/m3, is ______.
