Advertisements
Advertisements
प्रश्न
A mathematics aptitude test of 50 students was recored as follows:
| Marks | No. of students |
| 50-60 | 4 |
| 60-70 | 8 |
| 70-80 | 14 |
| 80-90 | 19 |
| 90-100 | 5 |
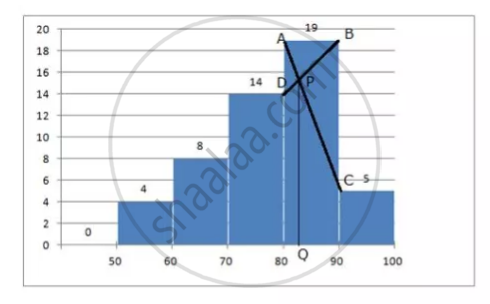
Draw a histrogram for the above data using a graph paper and locate the mode.
उत्तर

- Draw the histogram
- In the highest rectangle which represents modal class draw two lines AC and BD intersecting at P
- From P, draw a perpendicular to x-axis meeting at Q
- Value of Q is the mode = 82 (approx)
APPEARS IN
संबंधित प्रश्न
If the mean of the following distribution is 24, find the value of 'a '.
| Marks | 0-10 | 10-20 | 20-30 | 30-40 | 40-50 |
| Number of students |
7 | a | 8 | 10 | 5 |
If the mean of 6, 4, 7, ‘a’ and 10 is 8. Find the value of ‘a’
The following table shows the expenditure of 60 boys on books. Find the mode of their expenditure:
| Expenditure (Rs) | No. of students |
| 20 – 25 | 4 |
| 25 – 30 | 7 |
| 30 – 35 | 23 |
| 35 – 40 | 18 |
| 40 – 45 | 6 |
| 45 – 50 | 2 |
Find the mean of first 12 even numbers.
If the mean of 11 , 14 , p , 26 , 10 , 12 , 18 , 6 is 15, find p.
The heights of 9 persons are 142 cm, 158 cm, 152 cm, 143 cm, 139 cm, 144 cm, 146 cm, 148 cm and 151 cm. Find the mean height.
Estimate the median, the lower quartile and the upper quartile of the following frequency distribution by drawing an ogive:
| Class Interval | 0-10 | 10-20 | 20-30 | 30-40 | 40-50 | 50-60 | 60-70 |
| Frequency | 4 | 12 | 21 | 18 | 15 | 7 | 3 |
The mean of a certain number of observations is 32. Find the resulting mean, if the observation is, divided by 0.5
Find the mean of first five prime numbers.
The median of the data 12, 14, 23, 25, 34, 11, 42, 45, 32, 22, 44 is ___________
