Advertisements
Advertisements
प्रश्न
A mathematics aptitude test of 50 students was recored as follows:
| Marks | No. of students |
| 50-60 | 4 |
| 60-70 | 8 |
| 70-80 | 14 |
| 80-90 | 19 |
| 90-100 | 5 |
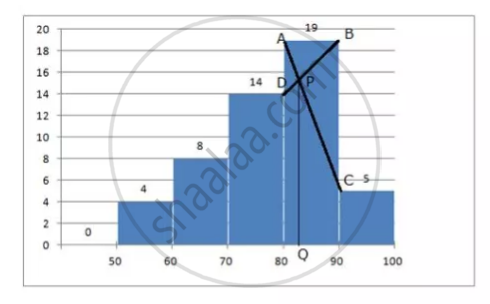
Draw a histrogram for the above data using a graph paper and locate the mode.
उत्तर

- Draw the histogram
- In the highest rectangle which represents modal class draw two lines AC and BD intersecting at P
- From P, draw a perpendicular to x-axis meeting at Q
- Value of Q is the mode = 82 (approx)
APPEARS IN
संबंधित प्रश्न
The following are the marks obtained by 70 boys in a class test:
| Marks | No. of boys |
| 30 – 40 | 10 |
| 40 – 50 | 12 |
| 50 – 60 | 14 |
| 60 – 70 | 12 |
| 70 – 80 | 9 |
| 80 – 90 | 7 |
| 90 – 100 | 6 |
Calculate the mean by:
Step-deviation method
Attempt this question on a graph paper. The table shows the distribution of marks gained by a group of 400 students in an examination.
|
Marks (Less than ) |
10 | 20 | 30 | 40 | 50 | 60 | 70 | 80 | 90 | 100 |
| No.of student | 5 | 10 | 30 | 60 | 105 | 180 | 270 | 355 | 390 | 400 |
Using scaie of 2cm to represent 10 marks and 2 cm to represent 50 student, plot these point and draw a smooth curve though the point
Estimate from the graph :
(1)the median marks
(2)the quartile marks.
Find the mode and the median of the following frequency distributions.
| x | 10 | 11 | 12 | 13 | 14 | 15 |
| f | 1 | 4 | 7 | 5 | 9 | 3 |
Find the mean of the following frequency distribution :
| class | 0-6 | 6-12 | 12-18 | 18-24 | 24-30 |
| Frequency | 7 | 5 | 10 | 12 | 6 |
Find the mean of all factors of 10.
Find the mean of: first five odd natural numbers
Height (in cm) of 7 boys of a locality are 144 cm, 155 cm, 168 cm, 163 cm, 167 cm, 151 cm and 158 cm. Find their mean height.
The median class for the given distribution is:
| Class Interval | 1 - 5 | 6 - 10 | 11 - 15 | 16 - 20 |
| Cumulative Frequency | 2 | 6 | 11 | 18 |
The measures of central tendency may not lie between the maximum and minimum values of data.
A die was thrown 15 times and the outcomes recorded were 5, 3, 4, 1, 2, 6, 4, 2, 2, 3, 1, 5, 6, 1, 2. Find the mean, median and mode of the data.
