Advertisements
Advertisements
प्रश्न
The monthly income of a group of 320 employees in a company is given below:
| Monthly income (thousands) | No. of employees |
| 6-7 | 20 |
| 7-8 | 45 |
| 8-9 | 65 |
| 9-10 | 95 |
| 10-11 | 60 |
| 11-12 | 30 |
| 12-13 | 5 |
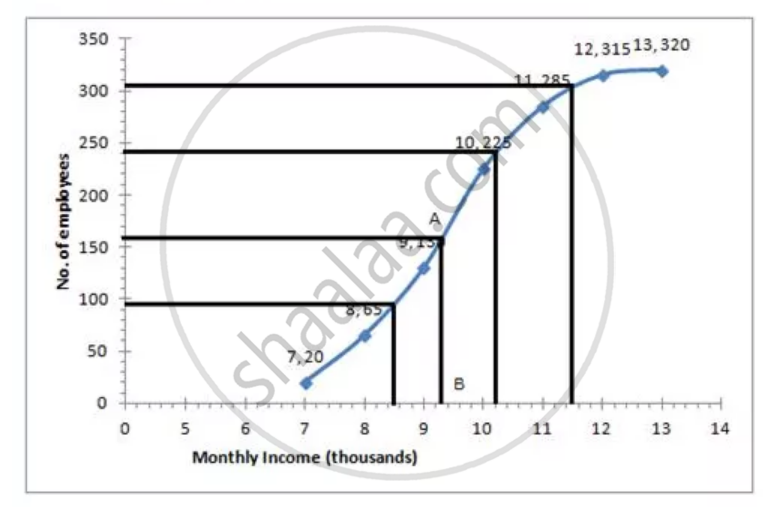
Draw an ogive of the distribution on a graph paper taking 2 cm = Rs. 1000 on one axis and 2 cm = 50 employees on the other axis. From the graph detemine:
- the median wage.
- number of employee whose income is below Rs. 8,500.
- If salary of a senior employee is above Rs. 11,500, find the number of senior employee in the company.
- the upper quartile.
उत्तर
| Monthly income (thousands) |
No. of employees (f) |
Cumulative frequency |
| 6-7 | 20 | 20 |
| 7-8 | 45 | 65 |
| 8-9 | 65 | 130 |
| 9-10 | 95 | 225 |
| 10-11 | 60 | 285 |
| 11-12 | 30 | 315 |
| 12-13 | 5 | 320 |
| Total | 320 |
Number of employees = 320

i. Median = `320/2` = 160th term
Through marks 160, draw a parallel line to x-axis which meets the curve at A. From A draw a perpendicular to x-axis meeting it at B. The value of point B is the median = Rs 9.3 thousands
ii. The number of employees with income below Rs. 8500 = 95 (approx from the graph)
iii. Number of employees with income below Rs. 11500 = 305 (approx from the graph)
Therefore number of employees with income (senior employees) = 320 - 305 = 15
iv. Upper quartile = Q3
= `320 xx 3/4`
= 240th term
= 10.3 thousands
= Rs. 10,300
APPEARS IN
संबंधित प्रश्न
Marks obtained by 40 students in a short assessment is given below, where a and b are two missing data.
| Marks | 5 | 6 | 7 | 8 | 9 |
| Number of Students | 6 | a | 16 | 13 | b |
If the mean of the distribution is 7.2, find a and b.
The following table gives the heights of plants in centimeter. If the mean height of plants is 60.95 cm; find the value of 'f'.
| Height (cm) | 50 | 55 | 58 | 60 | 65 | 70 | 71 |
| No. of plants | 2 | 4 | 10 | f | 5 | 4 | 3 |
In a school, 100 pupils have heights as tabulate below:
| Height (in cm) | No. of pupils |
| 121 – 130 | 12 |
| 131 – 140 | 16 |
| 141 – 150 | 30 |
| 151 – 160 | 20 |
| 161 – 170 | 14 |
| 171 – 180 | 8 |
Find the median height by drawing an ogive.
Draw a histogram and hence estimate the mode for the following frequency distribution:
| Class | 0-10 | 10-20 | 20-30 | 30-40 | 40-50 | 50-60 |
| Freq | 2 | 8 | 10 | 5 | 4 | 3 |
What is the median of 7, 10, 7, 5, 9, 10?
Find the median of the following:
25, 34, 31, 23, 22, 26, 35, 29, 20, 32
The rainfall (in mm) in a city on 7 days of a certain week is recorded as follows:
| Day: | Mon | Tue | Wed | Thus | Fri | Sat | Sun |
| Rainfall (in mm): | 0.5 | 2.7 | 2.6 | 0.5 | 2 | 5.8 | 1.5 |
Find the total and average (mean) rainfall for the week.
Find the mean and the median of: 10,12, 12, 15, 15, 17, 18, 18, 18 and 19
Find the median of the given data:
14, −3, 0, −2, −8, 13, −1, 7
If the extreme observations on both the ends of a data arranged in ascending order are removed, the median gets affected.
