Advertisements
Advertisements
प्रश्न
Calculate the mean of the distribution given below using the shortcut method.
| Marks | 11-20 | 21-30 | 31-40 | 41-50 | 51-60 | 61-70 | 71-80 |
| No. of students | 2 | 6 | 10 | 12 | 9 | 7 | 4 |
उत्तर
Let A be the assumed mean and d be the deviation of x from the assumed mean.
Let A = 45.5.
d = x – A
| Marks (C.I.) | No. of students (Frequency f) |
Mid-point of C.I. (x) |
d = x – A | f × d |
| 11-20 | 2 | 15.5 | -30 | -60 |
| 21-30 | 6 | 25.5 | -20 | -120 |
| 31-40 | 10 | 35.5 | -10 | -100 |
| 41-50 | 12 | 45.5 | 0 | 0 |
| 51-60 | 9 | 55.5 | 10 | 90 |
| 61-70 | 7 | 65.5 | 20 | 140 |
| 71-80 | 4 | 75.5 | 30 | 120 |
| `sumfd = 70` |
Mean = `A + (sumfd)/(sum f)`
`=> Mean = 45.5 + 70/50`
`=> Mean = 45.5 + 1.4`
`:. Mean = 45.9`
APPEARS IN
संबंधित प्रश्न
The distribution given below shows the marks obtained by 25 students in an aptitude test. Find the mean, median and mode of the distribution.
| Marks obtained | 5 | 6 | 7 | 8 | 9 | 10 |
| No. of students | 3 | 9 | 6 | 4 | 2 | 1 |
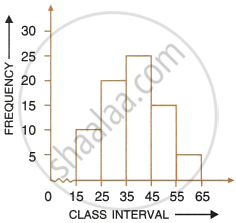
Using the information given in the adjoining histogram, calculate the mean.

Find the mean, median and mode of the following marks obtained by 16 students in a class test marked out of 10 marks:
0, 0, 2, 2, 3, 3, 3, 4, 5, 5, 5, 5, 6, 6, 7 and 8.
Following 10 observations are arranged in ascending order as follows.
2, 3, 5, 9, x + 1, x + 3, 14, 16, 19, 20
If the median of the data is 11, find the value of x.
Find the mean of the following frequency distribution by the step deviation method :
| Class | 0-20 | 20-40 | 40-60 | 60-80 | 80-100 | 100-120 | 120-140 |
| Frequency | 12 | 24 | 52 | 88 | 66 | 42 | 16 |
Find the mode of the following:
15, 17, 16, 17, 10, 12, 14, 16, 19, 12, 16, 15, 16
Find the median of 9, 3, 20, 13, 0, 7 and 10
Find the median of 80, 48, 66, 61, 75, 52, 45 and 70
Find the mean and the median of: 5, 8, 10, 11,13, 16, 19 and 20
Find the median of the 10 observations 36, 33, 45, 28, 39, 45, 54, 23, 56, 25. If another observation 35 is added to the above data, what would be the new median?
