Advertisements
Advertisements
प्रश्न
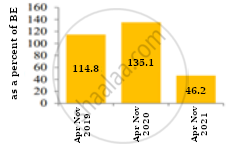
Compare the trends depicted in the figures given below:
| Figure 1: Trends in Fiscal deficit and Primary deficit |
Figure 2: Fiscal deficit as a percent of Budget estimate |
 |
 |
उत्तर
Considering the data represented in the given diagram, trend of year-on-year deficit (reporting for April to November) may be stated as follows:
- Fiscal Deficit in 2020 increased to 10.8 lakh crore from 8.1 lakh crore in 2019. In 2021 it has gone down to 7 lakh crore.
- Primary Deficit in 2020 increased to 6.9 lakh crore from 4.7 lakh crore in 2019. In 2021 it has gone down to 2.4 lakh crore.
- Fiscal Deficit in 2020 increased to 135.1% of Budget Expenditure from 114.8% in 2019. In year 2021, it is 46.2% of Budget Expenditure.
APPEARS IN
संबंधित प्रश्न
Explain 'Revenue Deficit in a Government budget? What does it indicate?
We suppose that C = 70 + 0.70Y D, I = 90, G = 100, T = 0.10Y (a) Find the equilibrium income. (b) What are tax revenues at equilibrium Income? Does the government have a balanced budget?
Explain the relation between government deficit and government debt.
Discuss the issue of deficit reduction.
What do you understand by G.S.T?
Answer the following question.
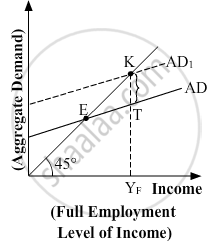
In the given figure, what does the gap 'KT' represent? State any two fiscal measures to correct the situation.

Regressive tax is that which is ______.
Fiscal deficit = ______.
Which of the following factors necessitated the need for economic reforms?
Read the following statements carefully and choose the correct alternatives given below:
Statement 1: Fiscal Deficit = Total Budget Expenditure - Total Budget Receipts (Net of borrowing)
Statement 2: Primary Deficit = Fiscal Deficit + Interest Payments.
A fiscal deficit is equal to borrowings. It is ______
When the revenue receipts are less than the revenue expenditures in a government budget, this shortfall is termed as
______ in the budget is an important measure of deficit.
The difference between fiscal deficit and interest payment is known as ______
How do we get the primary deficit from the fiscal deficit?
Primary deficit is borrowing requirements of government for making:
Fiscal Deficit equals:
Fiscal deficit equals:
