Advertisements
Advertisements
प्रश्न
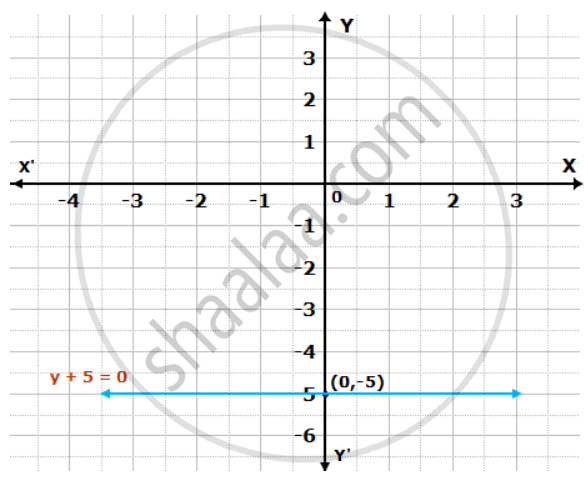
Draw the graphs of the following linear equations:
y + 5 = 0
उत्तर
Given equation, y + 5 = 0
i.e. y = -5
The graph is as follows:
APPEARS IN
संबंधित प्रश्न
Draw the graph of y = | x |.
Draw the graph for the equation given below; hence find the co-ordinates of the points where the graph is drawn meets the co-ordinates axes:
`(1)/(3) x +(1)/(5) y = 1`.
Use the graphical method to find the value of k, if:
(k, -3) lies on the straight line 2x + 3y = 1
Solve, graphically, the following pairs of equation :
x - 5 = 0
y + 4 = 0
Draw the graph of the equation
y = 5x - 4 Find graphically
a. the value of x, when y = 1
b. the value of y, when x = -2
Draw the graph of the following equation:
y = 6
The graph of the linear equation 2x + 3y = 6 cuts the y-axis at the point ______.
Determine the point on the graph of the linear equation 2x + 5y = 19, whose ordinate is `1 1/2` times its abscissa.
Draw the graph of the equation represented by a straight line which is parallel to the x-axis and at a distance 3 units below it.
The following observed values of x and y are thought to satisfy a linear equation. Write the linear equation:
| x | 6 | – 6 |
| y | –2 | 6 |
Draw the graph using the values of x, y as given in the above table. At what points the graph of the linear equation cuts the y-axis
