Advertisements
Advertisements
Question
Draw the graphs of the following linear equations:
y + 5 = 0
Solution
Given equation, y + 5 = 0
i.e. y = -5
The graph is as follows: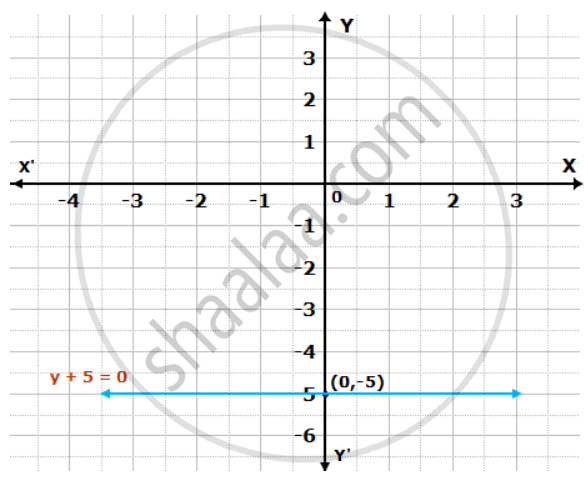
APPEARS IN
RELATED QUESTIONS
Draw the graph of the equation 2x + y = 6. Shade the region bounded by the graph and the
coordinate axes. Also, find the area of the shaded region.
Draw the graphs of the following linear equations on the same graph paper.
2x + 3y = 12, x – y = 1.
Find the co-ordinates of the vertices of the triangle formed by the two straight lines and the y-axis. Also, find the area of the triangle.
Draw the graph for the equation, given below :
x = 5
Draw the graph obtained from the table below:
| X | a | 3 | - 5 | 5 | c | - 1 |
| Y | - 1 | 2 | b | 3 | 4 | 0 |
Use the graph to find the values of a, b and c. State a linear relation between the variables x and y.
Draw the graphs of the following linear equations:
x = 3
Draw the graphs of the following linear equations:
5x - 5y = 8
Draw the graph of the equation
y = 5x - 4 Find graphically
a. the value of x, when y = 1
b. the value of y, when x = -2
y = px where p ∈ Z always passes through the _________
The point (0, 3) lies on the graph of the linear equation 3x + 4y = 12.
Write the linear equation such that each point on its graph has an ordinate 3 times its abscissa.
