Advertisements
Advertisements
Question
Draw the graph for the equation, given below :
x = 5
Solution
The graph x= 5 in the following figure is a straight line AB which is parallel to y-axis at a distance of 5 units from it.

APPEARS IN
RELATED QUESTIONS
If the point (3, 4) lies on the graph of the equation 3y = ax + 7, find the value of a.
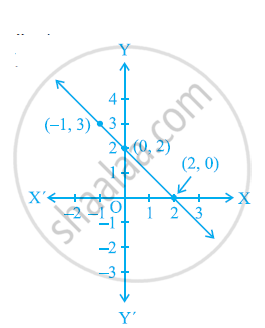
From the choices given below, choose the equation whose graphs are given in the given figures.
For the first figure
(i) y = x
(ii) x + y = 0
(iii) y = 2x
(iv) 2 + 3y = 7x

For the second figure
(i) y = x +2
(ii) y = x − 2
(iii) y = − x + 2
(iv) x + 2y = 6

If the work done by a body on application of a constant force is directly proportional to the distance travelled by the body, express this in the form of an equation in two variables and draw the graph of the same by taking the constant force as 5 units. Also read from the graph the work done when the distance travelled by the body is
(i) 2 units (ii) 0 unit
Draw the graph of the equation given below. Also, find the coordinates of the point
where the graph cuts the coordinate axes : 2x + y = 6
Draw the graph for the equation, given below :
5x + y + 5 = 0
Solve, graphically, the following pairs of equations :
`(x + 1)/(4) = (2)/(3)(1 - 2y)`
`(2 + 5y)/(3) = x/(7) -2`
The point (0, 3) lies on the graph of the linear equation 3x + 4y = 12.
Every point on the graph of a linear equation in two variables does not represent a solution of the linear equation.
Determine the point on the graph of the linear equation 2x + 5y = 19, whose ordinate is `1 1/2` times its abscissa.
The following observed values of x and y are thought to satisfy a linear equation. Write the linear equation:
| x | 6 | – 6 |
| y | –2 | 6 |
Draw the graph using the values of x, y as given in the above table. At what points the graph of the linear equation cuts the y-axis
