Advertisements
Advertisements
Question
Draw the graph of the equation given below. Also, find the coordinates of the point
where the graph cuts the coordinate axes : 2x + y = 6
Solution
we have
2x + y = 6
⇒ y = 6 - 2x ........... (1)
Putting x = 3 in (1) , we get y = 6 = 2 × 3 = 0
Putting x = 4 in (1) . we get y = 6 - 2 × 4 = - 2
Thus, we obtain the following table giving coordinates of two points on the line
represented by the equation 2x + y = 6
Graph of the equation 2x + y = 6

APPEARS IN
RELATED QUESTIONS
Plot the points (3, 5) and (− 1, 3) on a graph paper and verify that the straight line passing
through these points also passes through the point (1, 4).
From the choices given below, choose the equation whose graph is given in fig. below.
(i) y = x + 2 (ii) y = x – 2 (iii) y = −x + 2 (iv) x + 2y = 6
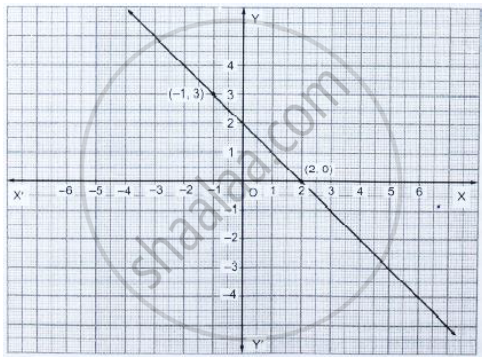
[Hint: Clearly, (2, 0) and (−1, 3) satisfy the equation y = −x + 2]
Draw the graph of the equatio ` x / y + y /4 = 1` Also, find the area of the triangle formed by the
line and the co-ordinates axes.
Draw the graph for the equation, given below :
2x + 3y = 0
Draw the graph of the equation
4x + 3y + 6 = 0
From the graph, find :
(i) y1, the value of y, when x = 12.
(ii) y2, the value of y, when x = - 6.
Use the graphical method to find the value of k, if:
(k, -3) lies on the straight line 2x + 3y = 1
Solve, graphically, the following pairs of equation :
x - 5 = 0
y + 4 = 0
Solve, graphically, the following pairs of equation :
3x + 7y = 27
8 - y = `(5)/(2)x`
Use the given table and draw the graph of a straight line.
| X | 1 | 2 | 3 | P |
| Y | 1 | q | -5 | 7 |
Find graphically the values of 'p' and 'q'.
Draw the graph of y = x – 4
