Advertisements
Advertisements
प्रश्न

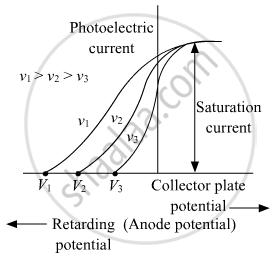
On the basis of the graphs shown in the figure, answer the following questions :
(a) Which physical parameter is kept constant for the three curves?
(b) Which is the highest frequency among v1, v2, and v3?
उत्तर

(a) Intensity is kept constant for all three curves. The given graph shows the variation of photocurrent with collector plate potential for the same intensity of light radiation at various frequencies.
(b) The stopping potential is found to be changing linearly with the frequency of incident light. The stopping potential is more negative for higher frequencies of incident radiation. As an increase in the frequency of the incident light increases the kinetic energy of the emitted electrons, so the greater retarding potential is required to stop them completely.
Hence higher the negative potential, the more the frequency of incident electrons.
As V1 is more negative than V2 and V2 is more negative than V3, hence, V1 > V2 > V3
APPEARS IN
संबंधित प्रश्न
A mercury lamp is a convenient source for studying frequency dependence of photoelectric emission, since it gives a number of spectral lines ranging from the UV to the red end of the visible spectrum. In our experiment with rubidium photo-cell, the following lines from a mercury source were used:
λ1 = 3650 Å, λ2 = 4047 Å, λ3 = 4358 Å, λ4 = 5461 Å, λ5 = 6907 Å,
The stopping voltages, respectively, were measured to be:
V01 = 1.28 V, V02 = 0.95 V, V03 = 0.74 V, V04 = 0.16 V, V05 = 0 V
Determine the value of Planck’s constant h, the threshold frequency and work function for the material.
[Note: You will notice that to get h from the data, you will need to know e (which you can take to be 1.6 × 10⁻¹⁹ C). Experiments of this kind on Na, Li, K, etc. were performed by Millikan, who, using his own value of e (from the oil-drop experiment) confirmed Einstein’s photoelectric equation and at the same time gave an independent estimate of the value of h.]
Should the energy of a photon be called its kinetic energy or its internal energy?
It is found that photosynthesis starts in certain plants when exposed to sunlight, but it does not start if the plants are exposed only to infrared light. Explain.
A photon of energy hv is absorbed by a free electron of a metal with work-function hv − φ.
In which of the following situations, the heavier of the two particles has smaller de Broglie wavelength? The two particles
(a) move with the same speed
(b) move with the same linear momentum
(c) move with the same kinetic energy
(d) have fallen through the same height
Calculate the momentum of a photon of light of wavelength 500 nm.
(Use h = 6.63 × 10⁻³⁴J-s = 4.14 × 10⁻¹⁵ eV-s, c = 3 × 10⁸ m/s and me = 9.1 × 10⁻³¹kg)
Find the maximum kinetic energy of the photoelectrons ejected when light of wavelength 350 nm is incident on a cesium surface. Work function of cesium = 1.9 eV
(Use h = 6.63 × 10⁻³⁴J-s = 4.14 × 10⁻¹⁵ eV-s, c = 3 × 10⁸ m/s and me = 9.1 × 10⁻³¹kg)
Find the maximum magnitude of the linear momentum of a photoelectron emitted when a wavelength of 400 nm falls on a metal with work function 2.5 eV.
(Use h = 6.63 × 10⁻³⁴J-s = 4.14 × 10⁻¹⁵ eV-s, c = 3 × 10⁸ m/s and me = 9.1 × 10⁻³¹kg)
A small piece of cesium metal (φ = 1.9 eV) is kept at a distance of 20 cm from a large metal plate with a charge density of 1.0 × 10⁻⁹ C m−2 on the surface facing the cesium piece. A monochromatic light of wavelength 400 nm is incident on the cesium piece. Find the minimum and maximum kinetic energy of the photoelectrons reaching the large metal plate. Neglect any change in electric field due to the small piece of cesium present.
(Use h = 6.63 × 10⁻³⁴J-s = 4.14 × 10⁻¹⁵ eV-s, c = 3 × 10⁸ m/s and me = 9.1 × 10⁻³¹kg)
Plot a graph showing the variation of photoelectric current, as a function of anode potential for two light beams having the same frequency but different intensities I1 and I2 (I1 > I2). Mention its important features.
