Advertisements
Advertisements
प्रश्न
The marks of 200 students in a test is given below :
| Marks% | 10-19 | 20-29 | 30-39 | 40-49 | 50-59 | 60-69 | 70-79 | 80-89 |
| No. of Students | 7 | 11 | 20 | 46 | 57 | 37 | 15 | 7 |
Draw an ogive and find
(i) the median
(ii) the number of students who scored more than 35% marks
उत्तर
We construct cumulative frequency table of the given distribution :
| Marks | No.of students (f) | Cumulative Frequency |
| 9.5-19.5 | 7 | 7 |
| 19.5-29.5 | 11 | 18 |
| 29.5-39.5 | 20 | 38 |
| 39.5-49.5 | 46 | 84 |
| 49.5-59.5 | 57 | 141 |
| 59.5-69.5 | 37 | 178 |
| 69.5-79.5 | 15 | 193 |
| 79.5-89.5 | 7 | 200 |
Take a graph paper and draw both the axes.
On the x -axis , take a scale of 1cm=10 to represent the marks.
On the y - axis , take a scale of 1 cm =50 to represent the no. of students .
Now, plot the points (19.5,7) ,(29.5,18) ,(39.5,38) ,( 49.5,84) ,(59.5,141) ,(69.5,178) ,(79.5,193) ,(89.5,200).
Join them by a smooth curve to get the ogive.
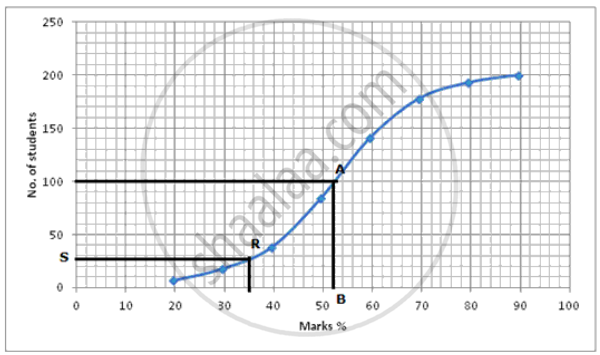
(i) No. of terms = 200
.·. Median= `(100 + 101)/2` = 100.5th term
Through mark of 100.5 on y-axis draw a line parallel to x-axis which meets the curve at A. From A, draw a perpendicular to x-axis which meets it at B.
The value of B is the median which is 52.
(ii) From marks % = 35 draw a line parallel to y-axis and meet the curve at R. From R, Draw a perpendicular on y-axis which meets it at S. The difference of the value obtained when subtracted from 200 gives the number of students who scored more than 35%.
⇒ 200 - 23 = 172
172 students scored more than 35 %
APPEARS IN
संबंधित प्रश्न
If the mean of the following distribution is 24, find the value of 'a '.
| Marks | 0-10 | 10-20 | 20-30 | 30-40 | 40-50 |
| Number of students |
7 | a | 8 | 10 | 5 |
Find the mean, median and mode of the following marks obtained by 16 students in a class test marked out of 10 marks:
0, 0, 2, 2, 3, 3, 3, 4, 5, 5, 5, 5, 6, 6, 7 and 8.
Draw an ogive for the data given below and from the graph determine:
- the median marks
- the number of students who obtained more than 75% marks
| Marks | No. of students |
| 0 – 9 | 5 |
| 10 – 19 | 9 |
| 20 – 29 | 16 |
| 30 – 39 | 22 |
| 40 – 49 | 26 |
| 50 – 59 | 18 |
| 60 – 69 | 11 |
| 70 – 79 | 6 |
| 80 – 89 | 4 |
| 90 – 99 | 3 |
Following 10 observations are arranged in ascending order as follows.
2, 3, 5, 9, x + 1, x + 3, 14, 16, 19, 20
If the median of the data is 11, find the value of x.
Find the mode of the following:
3, 4, 5, 7, 6, 3, 5, 4, 3, 5, 6, 4, 7, 5, 4, 5, 4, 3, 4, 5, 7, 6, 5, 6, 6, 7
Mean of 5 numbers is 20 and the mean of the other 5 numbers is 30. Find the mean of all the 10 numbers taken together.
Find the mean of: 2.1, 4.5, 5.2, 7.1 and 9.3
Find the mean of: 5, 2.4, 6.2, 8.9, 4.1 and 3.4
Find the mean of: all prime numbers between 20 and 40.
Find the median of the given data:
14, −3, 0, −2, −8, 13, −1, 7
