Advertisements
Advertisements
प्रश्न
The position-time (x-t) graphs for two children A and B returning from their school O to their homes P and Q respectively, are shown in the figure. Choose the correct entries in the brackets below;
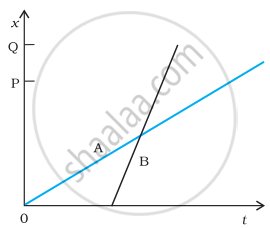
- (A/B) lives closer to the school than (B/A)
- (A/B) starts from the school earlier than (B/A)
- (A/B) walks faster than (B/A)
- A and B reach home at the (same/different) time
- (A/B) overtakes (B/A) on the road (once/twice).
उत्तर
- From the graph, it's clear that OQ > OP, which indicates that A lives closer to the school than B.
- In the graph, it can be seen that for x = 0, t = 0 for A, while for x = 0, t has a specific value for B. Hence, A starts his journey from school earlier than B.
- B walks faster than A because the slope of B's graph is greater than the slope of A's graph.
- Corresponding to P and Q, the time value t from the position-time graphs for A and B is the same, that is, OE. Therefore, both A and B arrive home at the same time.
- The position-time graphs for A and B intersect at one point, specifically D, and B starts from the school later, B overtakes A on the road only once.
APPEARS IN
संबंधित प्रश्न
Two projectiles A and B are projected with angle of projection 15° for the projectile A and 45° for the projectile B. If RA and RB be the horizontal range for the two projectiles, then
A particle moves along the X-axis as x = u (t − 2 s) + a (t − 2 s)2.
(a) the initial velocity of the particle is u
(b) the acceleration of the particle is a
(c) the acceleration of the particle is 2a
(d) at t = 2 s particle is at the origin.
A man has to go 50 m due north, 40 m due east and 20 m due south to reach a field. (a) What distance he has to walk to reach the field? (b) What is his displacement from his house to the field?
A particle starts from the origin, goes along the X-axis to the point (20 m, 0) and then return along the same line to the point (−20 m, 0). Find the distance and displacement of the particle during the trip.
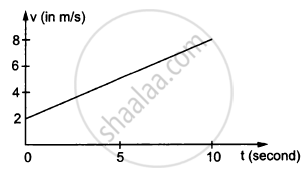
In the following figure Shows the graph of velocity versus time for a particle going along the X-axis. Find the acceleration
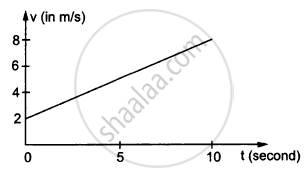
In the following figure Shows the graph of velocity versus time for a particle going along the X-axis. Find the distance travelled in 0 to 10s
Refer to the graphs in figure. Match the following.
| Graph | Characteristic |
(a) 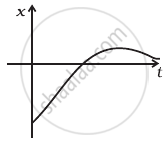 |
(i) has v > 0 and a < 0 throughout. |
(b) 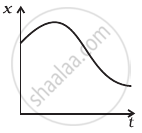 |
(ii) has x > 0 throughout and has a point with v = 0 and a point with a = 0. |
(c) 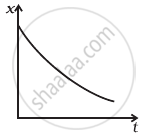 |
(iii) has a point with zero displacement for t > 0. |
(d) 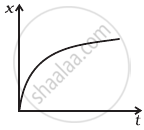 |
(iv) has v < 0 and a > 0. |
A ball is dropped and its displacement vs time graph is as shown figure (displacement x is from ground and all quantities are +ve upwards).
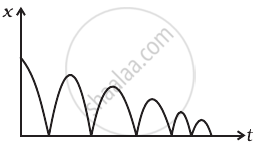
- Plot qualitatively velocity vs time graph.
- Plot qualitatively acceleration vs time graph.
The velocity-displacement graph of a particle is shown in figure.
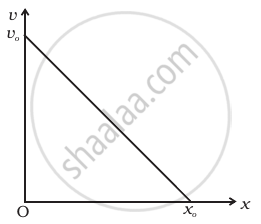
- Write the relation between v and x.
- Obtain the relation between acceleration and displacement and plot it.
Ship A is sailing towards the northeast with velocity `vecv = 30hati + 50hatj` km/hr where `hati` points east and `hatj`, north. Ship B is at a distance of 80 km east and 150 km north of Ship A and is sailing west at 10 km/hr. A will be at the minimum distance from B in ______.
