Advertisements
Advertisements
प्रश्न
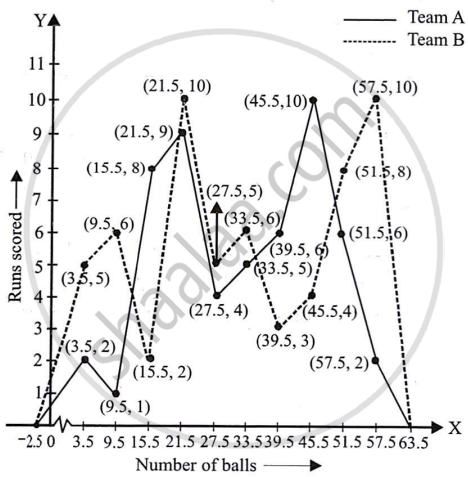
The runs scored by two teams A and B on the first 60 balls in a cricket match are given below:
| Number of balls | Team A | Team B |
| 1 - 6 | 2 | 5 |
| 7 - 12 | 1 | 6 |
| 13 - 18 | 8 | 2 |
| 19 - 24 | 9 | 10 |
| 25 - 30 | 4 | 5 |
| 31 - 36 | 5 | 6 |
| 37 - 42 | 6 | 3 |
| 43 - 48 | 10 | 4 |
| 49 - 54 | 6 | 8 |
| 55 - 60 | 2 | 10 |
Represent the data of both the teams on the same graph by frequency polygons.
[Hint: First make the class intervals continuous.]
उत्तर
It can be observed that the class intervals of the given data are not continuous. There is a gap of 1 between them. Therefore, `1/2` = 0.5 has to be added to the upper class limits and 0.5 has to be subtracted from the lower class limits.
Also, the class mark of each interval can be found by using the following formula.
Classmark = `"Upper class limit + Lower class limit"/2`
Continuous data with the class mark of each class interval can be represented as follows:
| Number of balls | Classmark | Team A | Team B |
| 0.5 − 6.5 | 3.5 | 2 | 5 |
| 6.5 − 12.5 | 9.5 | 1 | 6 |
| 12.5 − 18.5 | 15.5 | 8 | 2 |
| 18.5 − 24.5 | 21.5 | 9 | 10 |
| 24.5 − 30.5 | 27.5 | 4 | 5 |
| 30.5 − 36.5 | 33.5 | 5 | 6 |
| 36.5 − 42.5 | 39.5 | 6 | 3 |
| 42.5 − 48.5 | 45.5 | 10 | 4 |
| 48.5 − 54.5 | 51.5 | 6 | 8 |
| 54.5 − 60.5 | 57.5 | 2 | 10 |
By taking class marks on the x-axis and runs scored on the y-axis, a frequency polygon can be constructed as follows:
APPEARS IN
संबंधित प्रश्न
A random survey of the number of children of various age groups playing in a park was found as follows:
| Age (in years) | Number of children |
| 1 - 2 | 5 |
| 2 - 3 | 3 |
| 3 - 5 | 6 |
| 5 - 7 | 12 |
| 7 - 10 | 9 |
| 10 - 15 | 10 |
| 15 - 17 | 4 |
Draw a histogram to represent the data above.
Read the bar graph shown in Fig. 23.8 and answer the following questions:
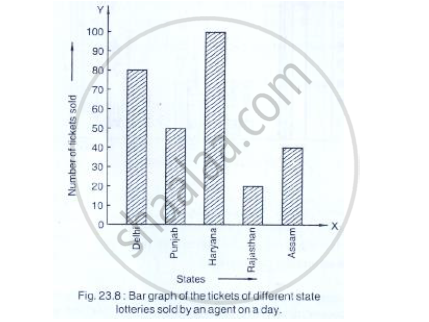
(i) What is the information given by the bar graph?
(ii) How many tickets of Assam State Lottery were sold by the agent?
(iii) Of which state, were the maximum number of tickets sold?
(iv) State whether true or false.
The maximum number of tickets sold is three times the minimum number of tickets sold.
(v) Of which state were the minimum number of tickets sold?
Read the following bar graph and answer the following questions:

(i) What information is given by the bar graph?
(ii) Which state is the largest producer of rice?
(iii) Which state is the largest producer of wheat?
(iv) Which state has total production of rice and wheat as its maximum?
(v) Which state has the total production of wheat and rice minimum?
Read the bar graph given in Fig. 23.19 and answer the following questions:
(i) What information is given by the bar graph?
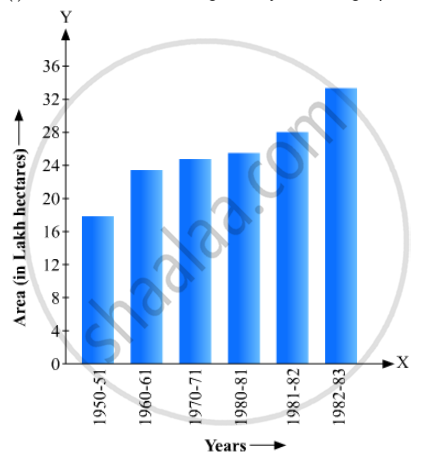
(ii) In which years the areas under the sugarcane crop were the maximum and the minimum?
(iii) State whether true or false:
The area under the sugarcane crop in the year 1982 - 83 is three times that of the year 1950 - 51
The following data gives the amount of manure (in thousand tonnes) manufactured by a company during some years:
| Year | 1992 | 1993 | 1994 | 1995 | 1996 | 1997 |
| Manure (in thousand tonnes) |
15 | 35 | 45 | 30 | 40 | 20 |
(i) Represent the above data with the help of a bar graph.
(ii) Indicate with the help of the bar graph the year in which the amount of manufactured by the company was maximum.
(iii) Choose the correct alternative:
The consecutive years during which there was maximum decrease in manure production are:
(a) 1994 and 1995
(b) 1992 and 1993
(c) 1996 and 1997
(d) 1995 and 1996
The production of oil (in lakh tonnes) in some of the refineries in India during 1982 was given below:
| Refinery: | Barauni | Koyali | Mathura | Mumbai | Florida |
| Production of oil (in lakh tonnes) |
30 | 70 | 40 | 45 | 25 |
Construct a bar graph to represent the above data so that the bars are drawn horizontally.
The expenditure (in 10 crores of rupees) on health by the Government of India during the various five year plans is shown below:
| Plans: | I | II | III | IV | V | VI |
| Expenditure on health (in 10 crores of rupees) |
7 | 14 | 23 | 34 | 76 | 182 |
Construct a bar graph to represent the above data.
The daily wages in a factory are distributed as follows:
|
Daily wages (in Rs.) |
125 - 175 |
175 - 225 |
225 - 275 |
275 - 325 |
325 - 375 |
|
Number of workers |
4 |
20 |
22 |
10 |
6 |
Draw a frequency polygon for this distribution.
Mr. Mirza’s monthly income is Rs. 7,200. He spends Rs. 1,800 on rent, Rs. 2,700 on food, Rs. 900 on the education of his children; Rs. 1,200 on Other things and saves the rest.
Draw a pie-chart to represent it.
The lengths of 62 leaves of a plant are measured in millimetres and the data is represented in the following table:
| Length (in mm) | Number of leaves |
| 118 – 126 | 8 |
| 127 – 135 | 10 |
| 136 – 144 | 12 |
| 145 – 153 | 17 |
| 154 – 162 | 7 |
| 163 – 171 | 5 |
| 172 – 180 | 3 |
Draw a histogram to represent the data above.
