Advertisements
Advertisements
Question
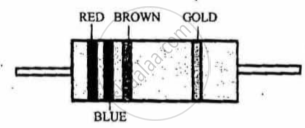
A carbon resistor has coloured bands as shown in Figure 2 below. The resistance of the resistor is:

figure 2
Options
260 ± 10%
260 ± 5%
2600 ± 5%
2600 ± 10%
Solution
A carbon resistor has coloured bands as shown in Figure 2 below. The resistance of the resistor is: 2600 ± 5%
APPEARS IN
RELATED QUESTIONS
A heating element using nichrome connected to a 230 V supply draws an initial current of 3.2 A which settles after a few seconds to a steady value of 2.8 A. What is the steady temperature of the heating element if the room temperature is 27.0°C? The temperature coefficient of resistance of nichrome averaged over the temperature range involved is 1.70 × 10⁻⁴ °C−1.
Consider a circuit containing an ideal battery connected to a resistor. Do "work done by the battery" and "the thermal energy developed" represent two names of the same physical quantity?
Two resistors R and 2R are connected in series in an electric circuit. The thermal energy developed in R and 2R are in the ratio ______________ .
As temperature increases, the viscosity of liquids decreases considerably. Will this decrease the resistance of an electrolyte as the temperature increases?
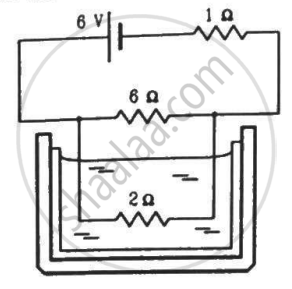
The 2.0 Ω resistor shown in the figure is dipped into a calorimeter containing water. The heat capacity of the calorimeter together with water is 2000 J K−1. (a) If the circuit is active for 15 minutes, what would be the rise in the temperature of the water? (b) Suppose the 6.0 Ω resistor gets burnt. What would be the rise in the temperature of the water in the next 15 minutes?

Find the neutral temperature and inversion temperature of a copper-iron thermocouple if the reference junction is kept at 0°C. Use the data given in the following table.
| Metal with lead (Pb) |
a `mu V"/"^oC` |
b `muV"/("^oC)` |
| Aluminium | -0.47 | 0.003 |
| Bismuth | -43.7 | -0.47 |
| Copper | 2.76 | 0.012 |
| Gold | 2.90 | 0.0093 |
| Iron | 16.6 | -0.030 |
| Nickel | 19.1 | -0.030 |
| Platinum | -1.79 | -0.035 |
| Silver | 2.50 | 0.012 |
| Steel | 10.8 | -0.016 |
Define temperature coefficient of resistance of the material of a conductor.
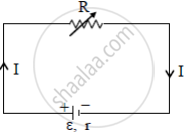
A variable resistor R is connected across a cell of emf ε and internal resistance r as shown in the figure. Draw a plot showing the variation of
(i) Terminal voltage V and
(ii) the current I, as a function of R.

By increasing the temperature, the specific resistance of a conductor and a semiconductor -
