Advertisements
Advertisements
Question
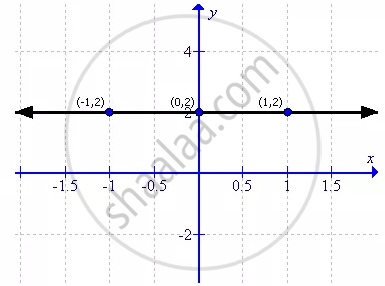
Draw the graph for the linear equation given below:
y - 2 = 0
Solution
First, prepare a table as follows:
| x | - 1 | 0 | 1 |
| y | 2 | 2 | 2 |
Thus the graph can be drawn as follows:
APPEARS IN
RELATED QUESTIONS
Draw the graph of the equation given below.
x + y = 2
Draw the graph of the equation given below.
3x - y = 0
Draw the graph for the linear equation given below:
y = - x
For the pair of linear equations given below, draw graphs and then state, whether the lines drawn are parallel or perpendicular to each other.
y = 3x - 1
y = 3x + 2
On the same graph paper, plot the graphs of y = 2x - 1, y = 2x and y = 2x + 1 from x = - 2 to x = 4. Are the graphs (lines) drawn parallel to each other?
Draw a graph of each of the following equations: 3x - 2y = 6
Draw a graph for each of the following equations and find the coordinates of the points where the line drawn meets the x-axis and y-axis: 2x + 3y = 12
Draw a graph of the equation 5x - 3y = 1. From the graph find the value of:
(i) x, when y = 8
(ii) y, when x = 2
Draw the graph of the lines represented by the equations 3x - 2y = 4 and x + y = 3 on the same graph. Find the coordinates of the point where they intersect. State, whether the lines are perpendicular to each other.
Draw the graph of the lines represented by the equations 5y = 3x + 1 and y = 2x + 3 on the same graph. Find the coordinates of the point where they intersect.
