Advertisements
Advertisements
Question
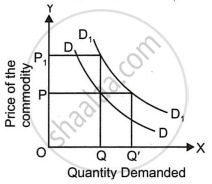
Explain the following diagram:

Solution
- In the diagram, the demand curve shifts to the right from DD to D1D1·
- It shows the situation of increase in demand.
- A larger quantity (OQ1) instead of OQ0 is demanded at the same price of OP1.
- Same quantity OQ0 is demanded at a higher price of OP1.
RELATED QUESTIONS
The demand curve is generally ______.
The market demand curve is a ______ summation of all Individual demand curves:
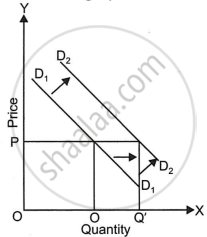
What does the graph below indicate?

Assertion (A): Demand curve is downward sloping.
Reason (R): Demand curve slopes downwards from left to the right because price and quantity demanded are inversely related.
Draw a neat labelled diagram of a demand curve.
Give two reasons for the shift of the demand curve towards the left.
Give two reasons for the shift of the demand curve towards the right.
Does a demand curve always have a negative slope? Give three reasons to justify your answer.
With the help of a diagram, show how a market demand curve can be obtained from individual demand curves.
Briefly explain any three determinants for the negative slope of the demand curve.
