Advertisements
Advertisements
Question
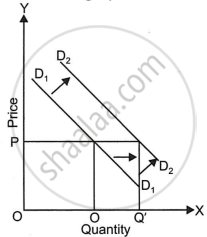
What does the graph below indicate?
Options
Increase in quantity demanded
Decrease in quantity demanded
Increase in demand
Decrease in demand
Solution
Increase in demand
APPEARS IN
RELATED QUESTIONS
The demand curve is generally ______.
The market demand curve is a ______ summation of all Individual demand curves:
Assertion (A): Demand curve is downward sloping.
Reason (R): Demand curve slopes downwards from left to the right because price and quantity demanded are inversely related.
Draw a neat labelled diagram of a demand curve.
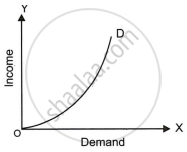
What does the demand curve given below show?
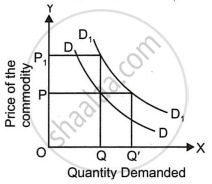
Explain the following diagram:
Give two reasons for the shift of the demand curve towards the left.
In 2002, the prices of gold nearly tripled. yet, as the price of gold rose its sales too increased. Does this mean that the demand curve for gold is upward sloping? Justify your answer.
With the help of a diagram, show how a market demand curve can be obtained from individual demand curves.
Briefly explain any three determinants for the negative slope of the demand curve.
