Advertisements
Advertisements
Question
Find the lower quartile, the upper quartile, the interquartile range and the semi-interquartile range for the following frequency distributions:
| Shoe size | 5 | 6 | 7 | 8 | 9 | 10 | 11 |
| Frequency | 8 | 1 | 7 | 14 | 11 | 5 | 4 |
Advertisements
Solution
| Shoe size | Frequency (f) | Cumulative frequency |
| 5 | 8 | 8 |
| 6 | 1 | 9 |
| 7 | 7 | 16 |
| 8 | 14 | 30 |
| 9 | 11 | 41 |
| 10 | 5 | 46 |
| 11 | 4 | 50 |
No. of terms = 50
Lower Quartile (Q1) = `n/4 = 50/4` = 12.5th term = 7
Upper Quartile (Q3) = `(n xx 3)/4 = (50 xx 3)/4` = 37.5th term = 9
Interquartile range = Q3 - Q1 = 9-7 = 2
Semi-interquartile range = `(Q_3 - Q_1)/2 = (9-7)/2 = 1`
Hence, Lower quartile = 7, upper quartile = 9, interquartile range = 2, semi-interquartile range = 1
APPEARS IN
RELATED QUESTIONS
For which of these would you use a histogram to show the data?
(a) The number of letters for different areas in a postman’s bag.
(b) The height of competitors in an athletics meet.
(c) The number of cassettes produced by 5 companies.
(d) The number of passengers boarding trains from 7:00 a.m. to 7:00 p.m. at a station.
Give reasons for each.
A Mathematics aptitude test of 50 students was recorded as follows:
| Marks | 50 - 60 | 60 - 70 | 70 - 80 | 80 - 90 | 90 – 100 |
| No. of Students | 4 | 8 | 14 | 19 | 5 |
Draw a histogram from the above data using a graph paper and locate the mode.
Draw histogram for the following frequency distributions:
| Class Interval | 10 – 16 | 16 – 22 | 22 – 28 | 28 – 34 | 34 – 40 |
| Frequency | 15 | 23 | 30 | 20 | 16 |
The following table is based on the marks of the first term examination of 10th class students. Show the information by a histogram. Also, draw a frequency polygon with the help of the histogram.
| Class-mark of marks | 325 | 375 | 425 | 475 | 525 | 575 |
| No. of students | 25 | 35 | 45 | 40 | 32 | 20 |
Construct a histogram for the following data:
| Monthly school fee (in Rs): | 30−60 | 60−90 | 90−120 | 120−150 | 150−180 | 180−210 | 210−240 |
| Number of schools: | 5 | 12 | 14 | 18 | 10 | 9 | 4 |
The following histogram shows the number of literate females in the age group of 10 to 40 years in a town: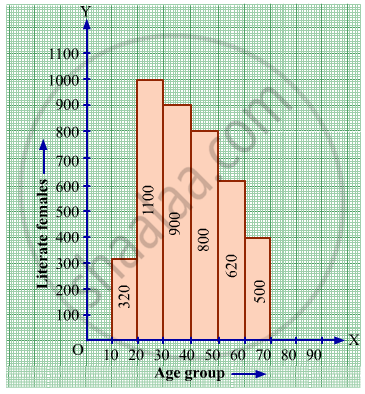
(i) Write the age group in which the number of literate female is the highest.
(ii) What is the class width?
(iii) What is the lowest frequency?
(iv) What are the class marks of the classes?
(v) In which age group literate females are the least?
Below is the histogram depicting marks obtained by 43 students of a class:
(i) Write the number of students getting the highest marks.
(ii) What is the class size?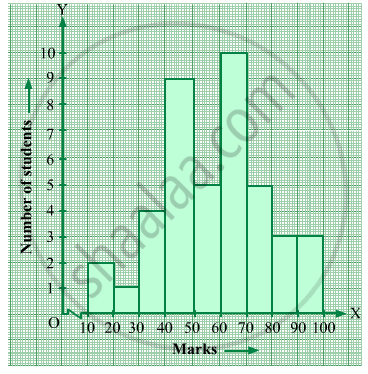
Construct a frequency polygon without using a histogram for the following frequency distribution :
| Class Mark | 10 | 15 | 20 | 25 | 30 | 35 | 40 |
| Frequency | 4 | 20 | 40 | 45 | 30 | 25 | 5 |
Identify the following data can be represented in a histogram?
The number of votes polled from 7 am to 6 pm in an election
Construct a histogram from the following distribution of total marks of 40 students in a class.
| Marks | 90 − 110 | 110 − 130 | 130 − 150 | 150 − 170 | 170 − 190 | 190 − 210 |
| No. of Students | 9 | 5 | 10 | 7 | 4 | 6 |
